Iroquois vs Spanish American 2 or more Vehicles in Household
COMPARE
Iroquois
Spanish American
2 or more Vehicles in Household
2 or more Vehicles in Household Comparison
Iroquois
Spanish Americans
54.7%
2 OR MORE VEHICLES IN HOUSEHOLD
22.6/ 100
METRIC RATING
195th/ 347
METRIC RANK
58.9%
2 OR MORE VEHICLES IN HOUSEHOLD
99.8/ 100
METRIC RATING
59th/ 347
METRIC RANK
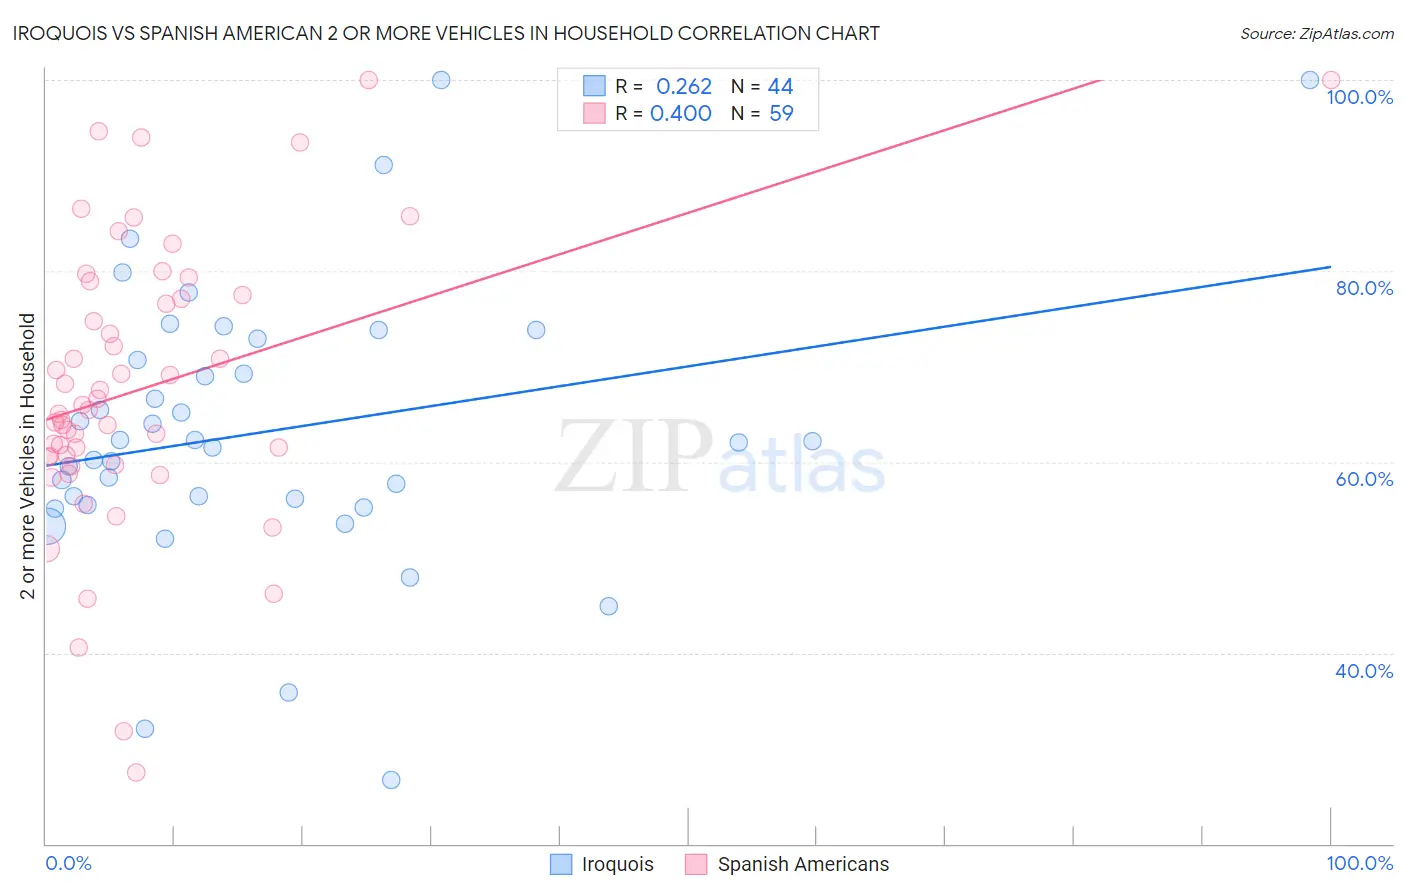
Iroquois vs Spanish American 2 or more Vehicles in Household Correlation Chart
The statistical analysis conducted on geographies consisting of 207,258,342 people shows a weak positive correlation between the proportion of Iroquois and percentage of households with 2 or more vehicles available in the United States with a correlation coefficient (R) of 0.262 and weighted average of 54.7%. Similarly, the statistical analysis conducted on geographies consisting of 103,168,567 people shows a moderate positive correlation between the proportion of Spanish Americans and percentage of households with 2 or more vehicles available in the United States with a correlation coefficient (R) of 0.400 and weighted average of 58.9%, a difference of 7.7%.
2 or more Vehicles in Household Correlation Summary
| Measurement | Iroquois | Spanish American |
| Minimum | 26.7% | 27.4% |
| Maximum | 100.0% | 100.0% |
| Range | 73.3% | 72.6% |
| Mean | 63.2% | 67.8% |
| Median | 62.1% | 65.5% |
| Interquartile 25% (IQ1) | 55.8% | 60.5% |
| Interquartile 75% (IQ3) | 71.8% | 77.5% |
| Interquartile Range (IQR) | 16.0% | 17.0% |
| Standard Deviation (Sample) | 14.9% | 14.9% |
| Standard Deviation (Population) | 14.7% | 14.8% |
Similar Demographics by 2 or more Vehicles in Household
Demographics Similar to Iroquois by 2 or more Vehicles in Household
In terms of 2 or more vehicles in household, the demographic groups most similar to Iroquois are Central American (54.7%, a difference of 0.030%), Immigrants from Japan (54.7%, a difference of 0.050%), Immigrants from Romania (54.7%, a difference of 0.070%), Immigrants (54.7%, a difference of 0.13%), and Russian (54.8%, a difference of 0.20%).
| Demographics | Rating | Rank | 2 or more Vehicles in Household |
| Marshallese | 30.5 /100 | #188 | Fair 54.9% |
| Eastern Europeans | 27.5 /100 | #189 | Fair 54.8% |
| Russians | 26.3 /100 | #190 | Fair 54.8% |
| Immigrants | Immigrants | 25.0 /100 | #191 | Fair 54.7% |
| Immigrants | Romania | 23.8 /100 | #192 | Fair 54.7% |
| Immigrants | Japan | 23.4 /100 | #193 | Fair 54.7% |
| Central Americans | 23.0 /100 | #194 | Fair 54.7% |
| Iroquois | 22.6 /100 | #195 | Fair 54.7% |
| Immigrants | Poland | 19.3 /100 | #196 | Poor 54.6% |
| Argentineans | 17.5 /100 | #197 | Poor 54.5% |
| Carpatho Rusyns | 16.2 /100 | #198 | Poor 54.4% |
| Immigrants | Norway | 15.9 /100 | #199 | Poor 54.4% |
| Houma | 15.8 /100 | #200 | Poor 54.4% |
| Immigrants | Italy | 15.5 /100 | #201 | Poor 54.4% |
| Immigrants | North Macedonia | 14.9 /100 | #202 | Poor 54.4% |
Demographics Similar to Spanish Americans by 2 or more Vehicles in Household
In terms of 2 or more vehicles in household, the demographic groups most similar to Spanish Americans are Immigrants from Scotland (58.9%, a difference of 0.020%), French Canadian (58.9%, a difference of 0.030%), Osage (58.8%, a difference of 0.16%), Nonimmigrants (58.8%, a difference of 0.19%), and Chickasaw (59.0%, a difference of 0.21%).
| Demographics | Rating | Rank | 2 or more Vehicles in Household |
| Immigrants | Laos | 99.9 /100 | #52 | Exceptional 59.2% |
| Celtics | 99.9 /100 | #53 | Exceptional 59.2% |
| Bhutanese | 99.9 /100 | #54 | Exceptional 59.1% |
| Luxembourgers | 99.9 /100 | #55 | Exceptional 59.1% |
| Chickasaw | 99.9 /100 | #56 | Exceptional 59.0% |
| Afghans | 99.9 /100 | #57 | Exceptional 59.0% |
| Immigrants | Scotland | 99.8 /100 | #58 | Exceptional 58.9% |
| Spanish Americans | 99.8 /100 | #59 | Exceptional 58.9% |
| French Canadians | 99.8 /100 | #60 | Exceptional 58.9% |
| Osage | 99.8 /100 | #61 | Exceptional 58.8% |
| Immigrants | Nonimmigrants | 99.8 /100 | #62 | Exceptional 58.8% |
| Mexican American Indians | 99.8 /100 | #63 | Exceptional 58.7% |
| Portuguese | 99.7 /100 | #64 | Exceptional 58.6% |
| Immigrants | Central America | 99.7 /100 | #65 | Exceptional 58.6% |
| Croatians | 99.7 /100 | #66 | Exceptional 58.6% |