Arab vs Icelander 4 or more Vehicles in Household
COMPARE
Arab
Icelander
4 or more Vehicles in Household
4 or more Vehicles in Household Comparison
Arabs
Icelanders
6.0%
4 OR MORE VEHICLES IN HOUSEHOLD
14.4/ 100
METRIC RATING
213th/ 347
METRIC RANK
7.4%
4 OR MORE VEHICLES IN HOUSEHOLD
99.9/ 100
METRIC RATING
74th/ 347
METRIC RANK
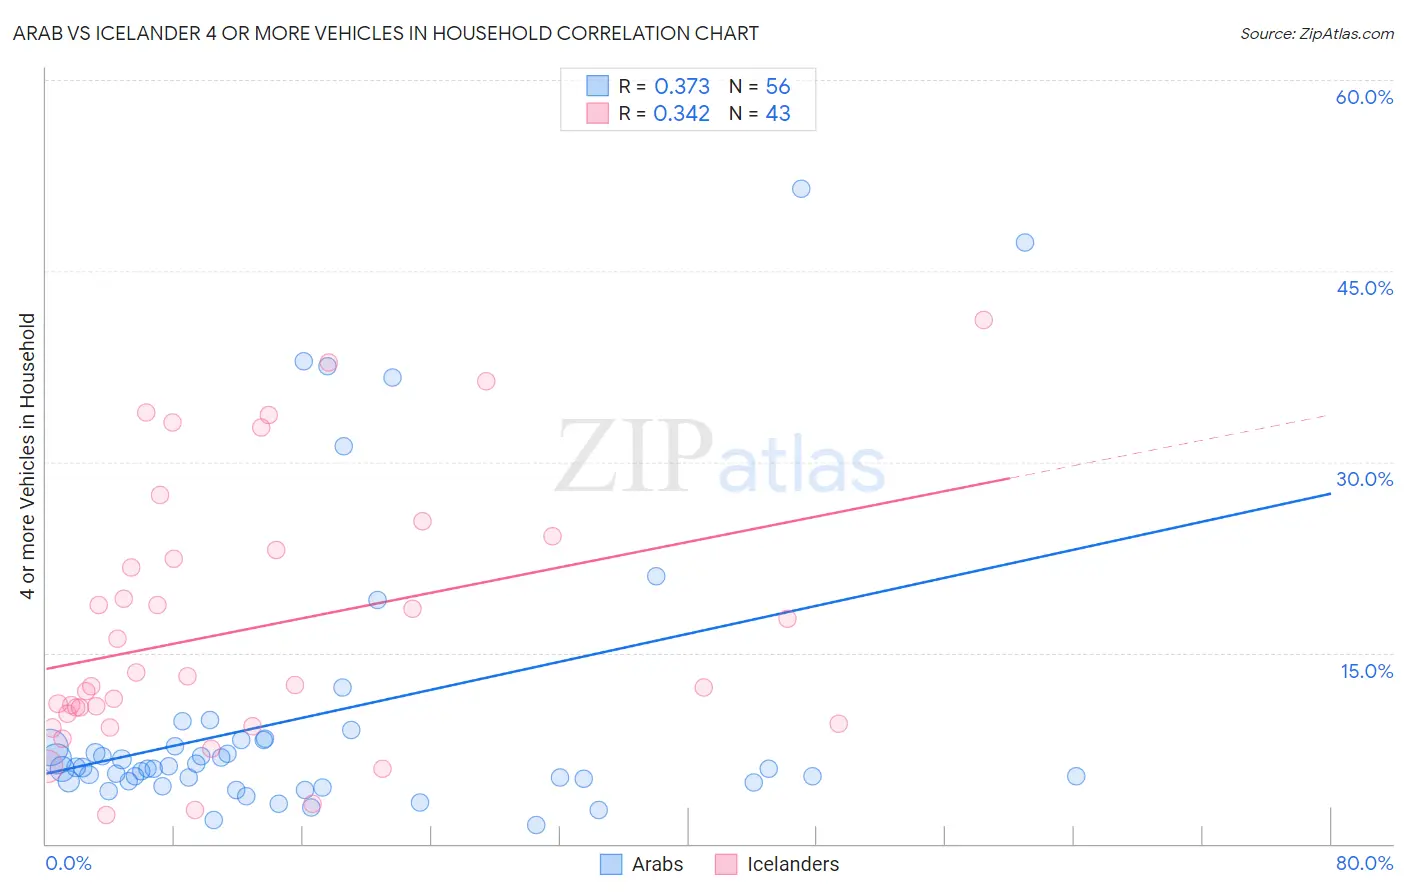
Arab vs Icelander 4 or more Vehicles in Household Correlation Chart
The statistical analysis conducted on geographies consisting of 484,302,602 people shows a mild positive correlation between the proportion of Arabs and percentage of households with 4 or more vehicles available in the United States with a correlation coefficient (R) of 0.373 and weighted average of 6.0%. Similarly, the statistical analysis conducted on geographies consisting of 159,406,151 people shows a mild positive correlation between the proportion of Icelanders and percentage of households with 4 or more vehicles available in the United States with a correlation coefficient (R) of 0.342 and weighted average of 7.4%, a difference of 22.3%.
4 or more Vehicles in Household Correlation Summary
| Measurement | Arab | Icelander |
| Minimum | 1.5% | 2.3% |
| Maximum | 51.4% | 41.2% |
| Range | 50.0% | 38.9% |
| Mean | 10.0% | 16.9% |
| Median | 5.9% | 12.5% |
| Interquartile 25% (IQ1) | 4.9% | 9.5% |
| Interquartile 75% (IQ3) | 8.1% | 23.1% |
| Interquartile Range (IQR) | 3.2% | 13.6% |
| Standard Deviation (Sample) | 11.3% | 10.3% |
| Standard Deviation (Population) | 11.2% | 10.2% |
Similar Demographics by 4 or more Vehicles in Household
Demographics Similar to Arabs by 4 or more Vehicles in Household
In terms of 4 or more vehicles in household, the demographic groups most similar to Arabs are Immigrants from Austria (6.0%, a difference of 0.020%), Immigrants from Egypt (6.0%, a difference of 0.060%), Panamanian (6.0%, a difference of 0.080%), Immigrants from China (6.0%, a difference of 0.13%), and Immigrants from Romania (6.0%, a difference of 0.13%).
| Demographics | Rating | Rank | 4 or more Vehicles in Household |
| Kenyans | 18.5 /100 | #206 | Poor 6.1% |
| Immigrants | Chile | 16.9 /100 | #207 | Poor 6.1% |
| Immigrants | Nigeria | 15.6 /100 | #208 | Poor 6.1% |
| Immigrants | Honduras | 15.4 /100 | #209 | Poor 6.1% |
| Immigrants | Zimbabwe | 15.1 /100 | #210 | Poor 6.0% |
| Panamanians | 14.8 /100 | #211 | Poor 6.0% |
| Immigrants | Egypt | 14.7 /100 | #212 | Poor 6.0% |
| Arabs | 14.4 /100 | #213 | Poor 6.0% |
| Immigrants | Austria | 14.3 /100 | #214 | Poor 6.0% |
| Immigrants | China | 13.8 /100 | #215 | Poor 6.0% |
| Immigrants | Romania | 13.8 /100 | #216 | Poor 6.0% |
| Nigerians | 12.2 /100 | #217 | Poor 6.0% |
| Immigrants | Italy | 11.0 /100 | #218 | Poor 6.0% |
| Serbians | 11.0 /100 | #219 | Poor 6.0% |
| Russians | 10.3 /100 | #220 | Poor 6.0% |
Demographics Similar to Icelanders by 4 or more Vehicles in Household
In terms of 4 or more vehicles in household, the demographic groups most similar to Icelanders are Immigrants from Cambodia (7.4%, a difference of 0.0%), Laotian (7.4%, a difference of 0.050%), Apache (7.4%, a difference of 0.22%), White/Caucasian (7.4%, a difference of 0.29%), and Portuguese (7.4%, a difference of 0.30%).
| Demographics | Rating | Rank | 4 or more Vehicles in Household |
| Americans | 99.9 /100 | #67 | Exceptional 7.5% |
| Welsh | 99.9 /100 | #68 | Exceptional 7.5% |
| Germans | 99.9 /100 | #69 | Exceptional 7.5% |
| Scottish | 99.9 /100 | #70 | Exceptional 7.4% |
| Chickasaw | 99.9 /100 | #71 | Exceptional 7.4% |
| Scotch-Irish | 99.9 /100 | #72 | Exceptional 7.4% |
| Portuguese | 99.9 /100 | #73 | Exceptional 7.4% |
| Icelanders | 99.9 /100 | #74 | Exceptional 7.4% |
| Immigrants | Cambodia | 99.9 /100 | #75 | Exceptional 7.4% |
| Laotians | 99.9 /100 | #76 | Exceptional 7.4% |
| Apache | 99.9 /100 | #77 | Exceptional 7.4% |
| Whites/Caucasians | 99.8 /100 | #78 | Exceptional 7.4% |
| Czechs | 99.8 /100 | #79 | Exceptional 7.4% |
| Alaska Natives | 99.8 /100 | #80 | Exceptional 7.3% |
| Finns | 99.8 /100 | #81 | Exceptional 7.3% |