Irish vs Icelander No Schooling Completed
COMPARE
Irish
Icelander
No Schooling Completed
No Schooling Completed Comparison
Irish
Icelanders
1.4%
NO SCHOOLING COMPLETED
100.0/ 100
METRIC RATING
12th/ 347
METRIC RANK
1.7%
NO SCHOOLING COMPLETED
99.3/ 100
METRIC RATING
81st/ 347
METRIC RANK
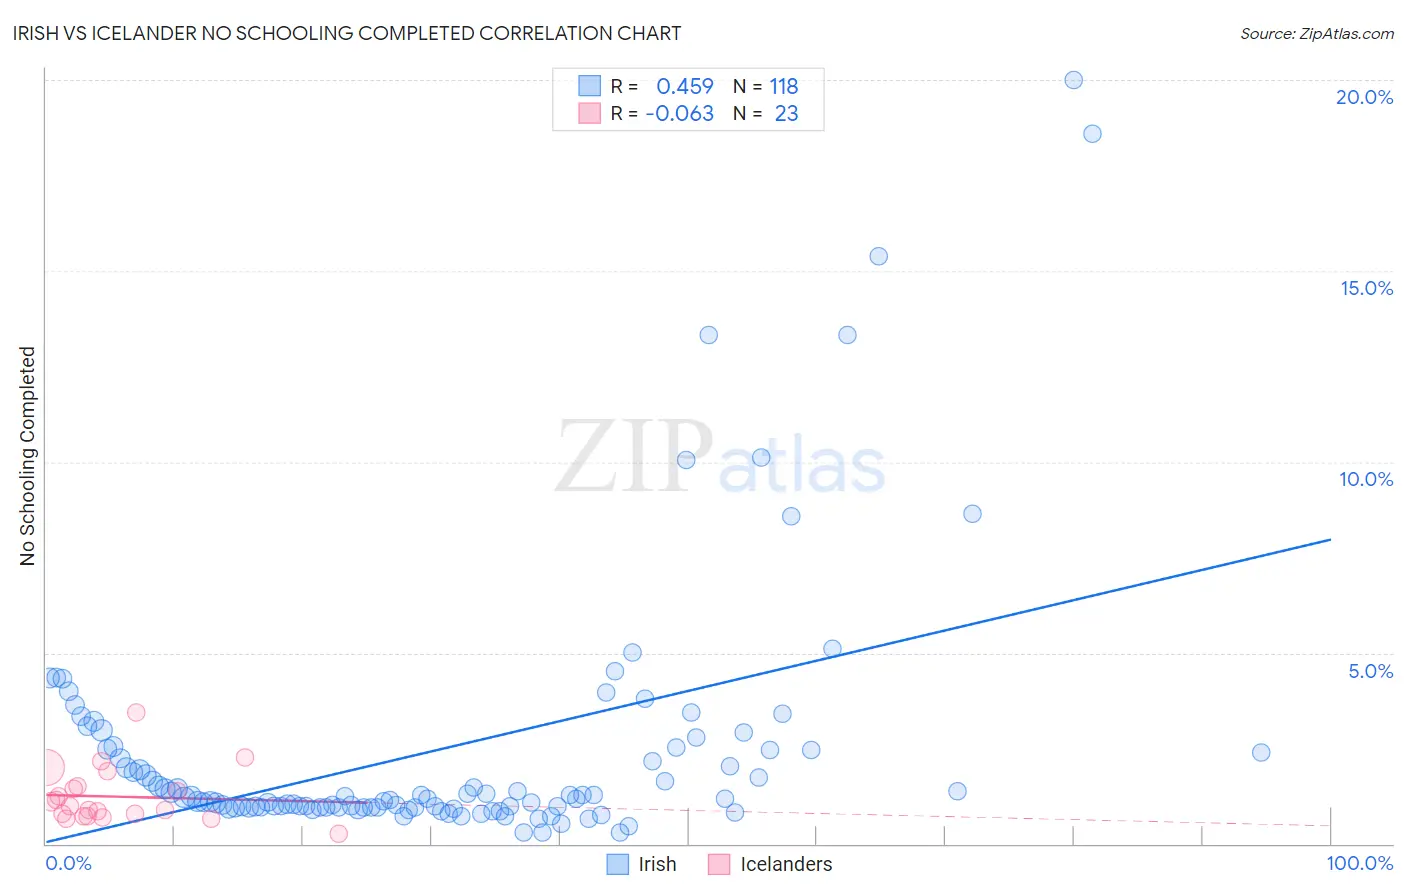
Irish vs Icelander No Schooling Completed Correlation Chart
The statistical analysis conducted on geographies consisting of 558,904,841 people shows a moderate positive correlation between the proportion of Irish and percentage of population with no schooling in the United States with a correlation coefficient (R) of 0.459 and weighted average of 1.4%. Similarly, the statistical analysis conducted on geographies consisting of 158,793,284 people shows a slight negative correlation between the proportion of Icelanders and percentage of population with no schooling in the United States with a correlation coefficient (R) of -0.063 and weighted average of 1.7%, a difference of 21.4%.
No Schooling Completed Correlation Summary
| Measurement | Irish | Icelander |
| Minimum | 0.30% | 0.25% |
| Maximum | 20.0% | 3.4% |
| Range | 19.7% | 3.2% |
| Mean | 2.5% | 1.2% |
| Median | 1.2% | 0.97% |
| Interquartile 25% (IQ1) | 0.96% | 0.72% |
| Interquartile 75% (IQ3) | 2.5% | 1.5% |
| Interquartile Range (IQR) | 1.5% | 0.77% |
| Standard Deviation (Sample) | 3.4% | 0.71% |
| Standard Deviation (Population) | 3.4% | 0.70% |
Similar Demographics by No Schooling Completed
Demographics Similar to Irish by No Schooling Completed
In terms of no schooling completed, the demographic groups most similar to Irish are Lithuanian (1.4%, a difference of 0.030%), Polish (1.4%, a difference of 0.030%), Dutch (1.4%, a difference of 0.86%), Scotch-Irish (1.5%, a difference of 0.97%), and Tlingit-Haida (1.5%, a difference of 1.0%).
| Demographics | Rating | Rank | No Schooling Completed |
| Slovenes | 100.0 /100 | #5 | Exceptional 1.4% |
| Carpatho Rusyns | 100.0 /100 | #6 | Exceptional 1.4% |
| English | 100.0 /100 | #7 | Exceptional 1.4% |
| Swedes | 100.0 /100 | #8 | Exceptional 1.4% |
| Scottish | 100.0 /100 | #9 | Exceptional 1.4% |
| Dutch | 100.0 /100 | #10 | Exceptional 1.4% |
| Lithuanians | 100.0 /100 | #11 | Exceptional 1.4% |
| Irish | 100.0 /100 | #12 | Exceptional 1.4% |
| Poles | 100.0 /100 | #13 | Exceptional 1.4% |
| Scotch-Irish | 100.0 /100 | #14 | Exceptional 1.5% |
| Tlingit-Haida | 100.0 /100 | #15 | Exceptional 1.5% |
| Finns | 100.0 /100 | #16 | Exceptional 1.5% |
| Croatians | 100.0 /100 | #17 | Exceptional 1.5% |
| Danes | 100.0 /100 | #18 | Exceptional 1.5% |
| Alaskan Athabascans | 100.0 /100 | #19 | Exceptional 1.5% |
Demographics Similar to Icelanders by No Schooling Completed
In terms of no schooling completed, the demographic groups most similar to Icelanders are Cypriot (1.7%, a difference of 0.040%), Macedonian (1.7%, a difference of 0.050%), Immigrants from South Africa (1.7%, a difference of 0.090%), Delaware (1.7%, a difference of 0.13%), and Immigrants from Sweden (1.7%, a difference of 0.17%).
| Demographics | Rating | Rank | No Schooling Completed |
| Zimbabweans | 99.4 /100 | #74 | Exceptional 1.7% |
| Immigrants | Belgium | 99.3 /100 | #75 | Exceptional 1.7% |
| Cherokee | 99.3 /100 | #76 | Exceptional 1.7% |
| Immigrants | Sweden | 99.3 /100 | #77 | Exceptional 1.7% |
| Delaware | 99.3 /100 | #78 | Exceptional 1.7% |
| Macedonians | 99.3 /100 | #79 | Exceptional 1.7% |
| Cypriots | 99.3 /100 | #80 | Exceptional 1.7% |
| Icelanders | 99.3 /100 | #81 | Exceptional 1.7% |
| Immigrants | South Africa | 99.3 /100 | #82 | Exceptional 1.7% |
| Potawatomi | 99.3 /100 | #83 | Exceptional 1.7% |
| Immigrants | Denmark | 99.2 /100 | #84 | Exceptional 1.7% |
| Immigrants | Australia | 99.2 /100 | #85 | Exceptional 1.7% |
| Ukrainians | 99.2 /100 | #86 | Exceptional 1.8% |
| Osage | 99.2 /100 | #87 | Exceptional 1.8% |
| Immigrants | Western Europe | 99.2 /100 | #88 | Exceptional 1.8% |