Trinidadian and Tobagonian vs Icelander 4 or more Vehicles in Household
COMPARE
Trinidadian and Tobagonian
Icelander
4 or more Vehicles in Household
4 or more Vehicles in Household Comparison
Trinidadians and Tobagonians
Icelanders
4.3%
4 OR MORE VEHICLES IN HOUSEHOLD
0.0/ 100
METRIC RATING
328th/ 347
METRIC RANK
7.4%
4 OR MORE VEHICLES IN HOUSEHOLD
99.9/ 100
METRIC RATING
74th/ 347
METRIC RANK
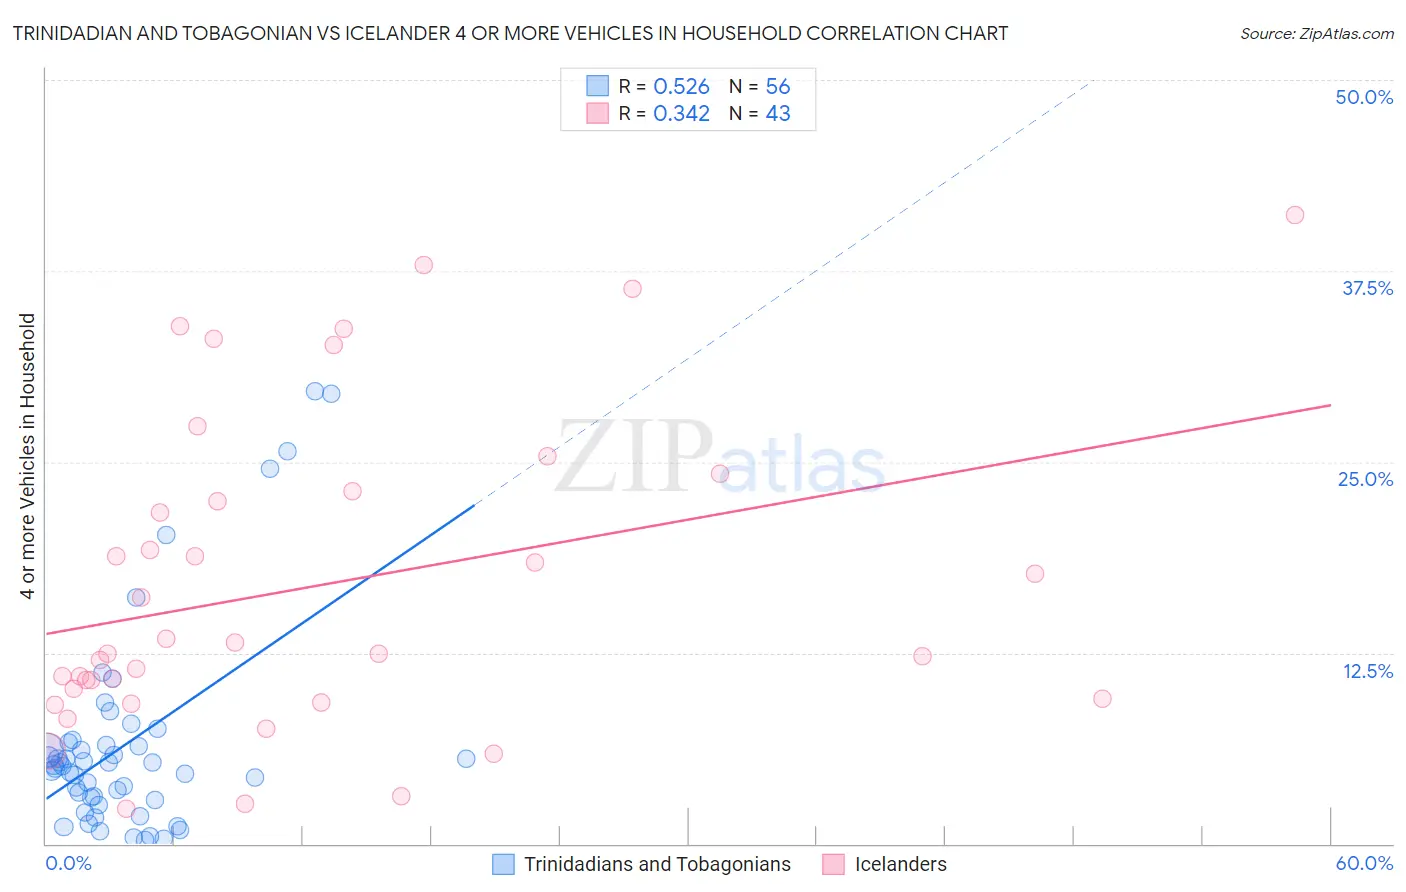
Trinidadian and Tobagonian vs Icelander 4 or more Vehicles in Household Correlation Chart
The statistical analysis conducted on geographies consisting of 218,579,847 people shows a substantial positive correlation between the proportion of Trinidadians and Tobagonians and percentage of households with 4 or more vehicles available in the United States with a correlation coefficient (R) of 0.526 and weighted average of 4.3%. Similarly, the statistical analysis conducted on geographies consisting of 159,406,151 people shows a mild positive correlation between the proportion of Icelanders and percentage of households with 4 or more vehicles available in the United States with a correlation coefficient (R) of 0.342 and weighted average of 7.4%, a difference of 73.6%.
4 or more Vehicles in Household Correlation Summary
| Measurement | Trinidadian and Tobagonian | Icelander |
| Minimum | 0.23% | 2.3% |
| Maximum | 29.6% | 41.2% |
| Range | 29.4% | 38.9% |
| Mean | 6.6% | 16.9% |
| Median | 5.1% | 12.5% |
| Interquartile 25% (IQ1) | 3.0% | 9.5% |
| Interquartile 75% (IQ3) | 6.6% | 23.1% |
| Interquartile Range (IQR) | 3.6% | 13.6% |
| Standard Deviation (Sample) | 6.8% | 10.3% |
| Standard Deviation (Population) | 6.8% | 10.2% |
Similar Demographics by 4 or more Vehicles in Household
Demographics Similar to Trinidadians and Tobagonians by 4 or more Vehicles in Household
In terms of 4 or more vehicles in household, the demographic groups most similar to Trinidadians and Tobagonians are Immigrants from Senegal (4.2%, a difference of 0.27%), Immigrants from Ecuador (4.2%, a difference of 0.47%), West Indian (4.2%, a difference of 0.73%), Senegalese (4.3%, a difference of 1.6%), and Immigrants from Dominica (4.2%, a difference of 1.6%).
| Demographics | Rating | Rank | 4 or more Vehicles in Household |
| Ecuadorians | 0.0 /100 | #321 | Tragic 4.5% |
| Immigrants | Yemen | 0.0 /100 | #322 | Tragic 4.5% |
| Immigrants | Caribbean | 0.0 /100 | #323 | Tragic 4.4% |
| Soviet Union | 0.0 /100 | #324 | Tragic 4.4% |
| Immigrants | Jamaica | 0.0 /100 | #325 | Tragic 4.4% |
| Cape Verdeans | 0.0 /100 | #326 | Tragic 4.4% |
| Senegalese | 0.0 /100 | #327 | Tragic 4.3% |
| Trinidadians and Tobagonians | 0.0 /100 | #328 | Tragic 4.3% |
| Immigrants | Senegal | 0.0 /100 | #329 | Tragic 4.2% |
| Immigrants | Ecuador | 0.0 /100 | #330 | Tragic 4.2% |
| West Indians | 0.0 /100 | #331 | Tragic 4.2% |
| Immigrants | Dominica | 0.0 /100 | #332 | Tragic 4.2% |
| Immigrants | Albania | 0.0 /100 | #333 | Tragic 4.1% |
| Immigrants | Trinidad and Tobago | 0.0 /100 | #334 | Tragic 4.1% |
| Barbadians | 0.0 /100 | #335 | Tragic 3.9% |
Demographics Similar to Icelanders by 4 or more Vehicles in Household
In terms of 4 or more vehicles in household, the demographic groups most similar to Icelanders are Immigrants from Cambodia (7.4%, a difference of 0.0%), Laotian (7.4%, a difference of 0.050%), Apache (7.4%, a difference of 0.22%), White/Caucasian (7.4%, a difference of 0.29%), and Portuguese (7.4%, a difference of 0.30%).
| Demographics | Rating | Rank | 4 or more Vehicles in Household |
| Americans | 99.9 /100 | #67 | Exceptional 7.5% |
| Welsh | 99.9 /100 | #68 | Exceptional 7.5% |
| Germans | 99.9 /100 | #69 | Exceptional 7.5% |
| Scottish | 99.9 /100 | #70 | Exceptional 7.4% |
| Chickasaw | 99.9 /100 | #71 | Exceptional 7.4% |
| Scotch-Irish | 99.9 /100 | #72 | Exceptional 7.4% |
| Portuguese | 99.9 /100 | #73 | Exceptional 7.4% |
| Icelanders | 99.9 /100 | #74 | Exceptional 7.4% |
| Immigrants | Cambodia | 99.9 /100 | #75 | Exceptional 7.4% |
| Laotians | 99.9 /100 | #76 | Exceptional 7.4% |
| Apache | 99.9 /100 | #77 | Exceptional 7.4% |
| Whites/Caucasians | 99.8 /100 | #78 | Exceptional 7.4% |
| Czechs | 99.8 /100 | #79 | Exceptional 7.4% |
| Alaska Natives | 99.8 /100 | #80 | Exceptional 7.3% |
| Finns | 99.8 /100 | #81 | Exceptional 7.3% |