Immigrants from Congo vs Immigrants from South Eastern Asia 3 or more Vehicles in Household
COMPARE
Immigrants from Congo
Immigrants from South Eastern Asia
3 or more Vehicles in Household
3 or more Vehicles in Household Comparison
Immigrants from Congo
Immigrants from South Eastern Asia
17.0%
3 OR MORE VEHICLES IN HOUSEHOLD
0.1/ 100
METRIC RATING
291st/ 347
METRIC RANK
23.1%
3 OR MORE VEHICLES IN HOUSEHOLD
100.0/ 100
METRIC RATING
30th/ 347
METRIC RANK
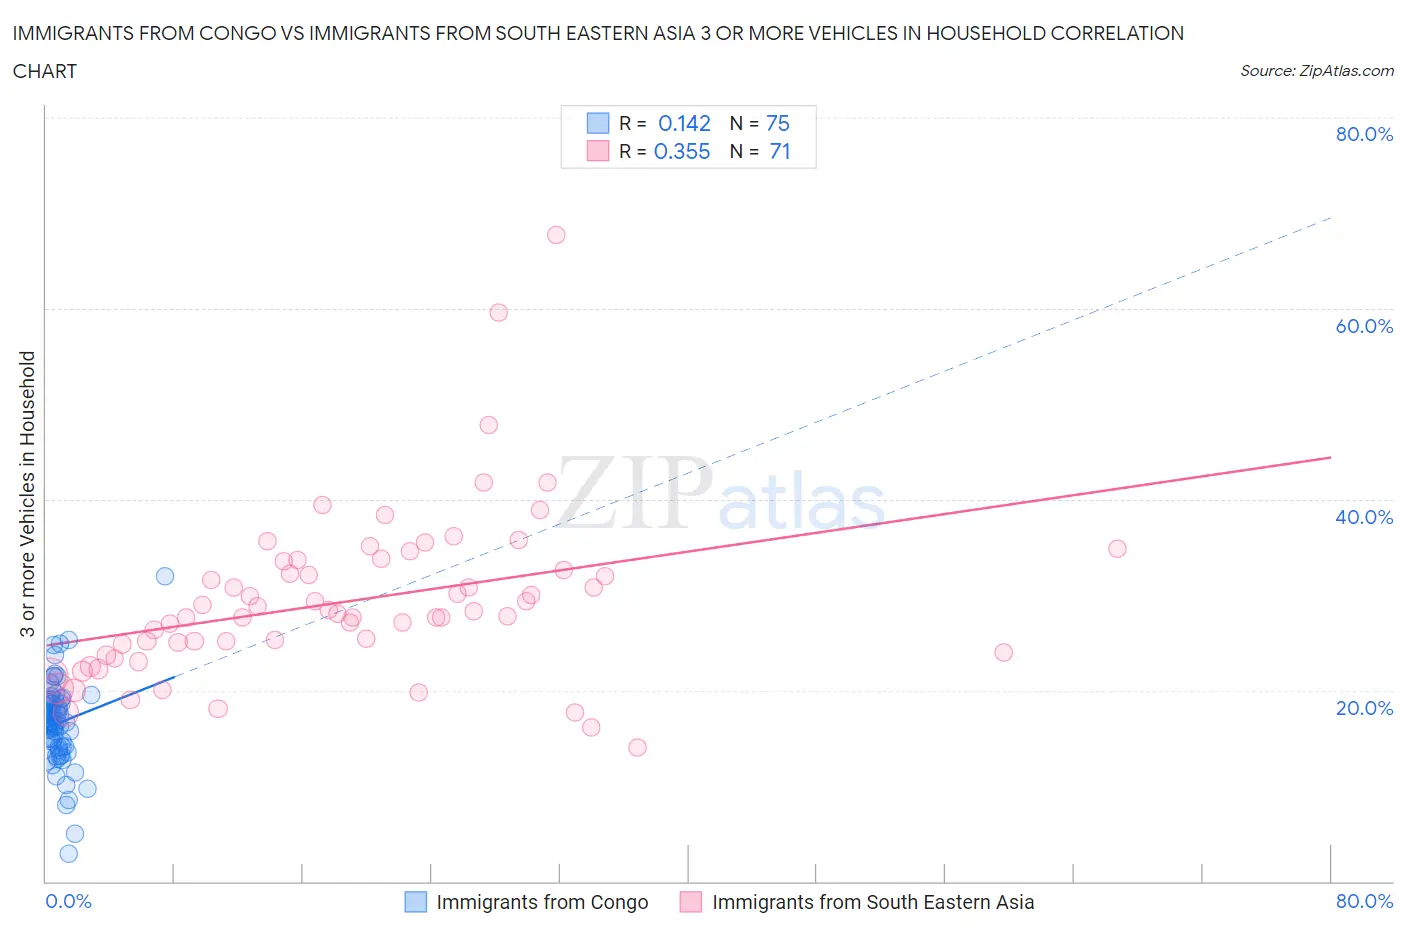
Immigrants from Congo vs Immigrants from South Eastern Asia 3 or more Vehicles in Household Correlation Chart
The statistical analysis conducted on geographies consisting of 92,073,111 people shows a poor positive correlation between the proportion of Immigrants from Congo and percentage of households with 3 or more vehicles available in the United States with a correlation coefficient (R) of 0.142 and weighted average of 17.0%. Similarly, the statistical analysis conducted on geographies consisting of 512,036,207 people shows a mild positive correlation between the proportion of Immigrants from South Eastern Asia and percentage of households with 3 or more vehicles available in the United States with a correlation coefficient (R) of 0.355 and weighted average of 23.1%, a difference of 36.1%.
3 or more Vehicles in Household Correlation Summary
| Measurement | Immigrants from Congo | Immigrants from South Eastern Asia |
| Minimum | 2.9% | 14.1% |
| Maximum | 32.0% | 67.7% |
| Range | 29.0% | 53.6% |
| Mean | 16.6% | 29.3% |
| Median | 16.7% | 28.1% |
| Interquartile 25% (IQ1) | 14.1% | 24.0% |
| Interquartile 75% (IQ3) | 18.9% | 33.5% |
| Interquartile Range (IQR) | 4.9% | 9.5% |
| Standard Deviation (Sample) | 4.5% | 8.8% |
| Standard Deviation (Population) | 4.4% | 8.8% |
Similar Demographics by 3 or more Vehicles in Household
Demographics Similar to Immigrants from Congo by 3 or more Vehicles in Household
In terms of 3 or more vehicles in household, the demographic groups most similar to Immigrants from Congo are Immigrants from Spain (17.0%, a difference of 0.11%), Liberian (17.0%, a difference of 0.15%), Bahamian (16.9%, a difference of 0.20%), Immigrants from Western Africa (16.9%, a difference of 0.31%), and Immigrants from Russia (16.9%, a difference of 0.36%).
| Demographics | Rating | Rank | 3 or more Vehicles in Household |
| Immigrants | Colombia | 0.3 /100 | #284 | Tragic 17.3% |
| Immigrants | Croatia | 0.2 /100 | #285 | Tragic 17.2% |
| Menominee | 0.2 /100 | #286 | Tragic 17.2% |
| Immigrants | Brazil | 0.2 /100 | #287 | Tragic 17.1% |
| Immigrants | Uruguay | 0.2 /100 | #288 | Tragic 17.1% |
| Immigrants | Liberia | 0.1 /100 | #289 | Tragic 17.1% |
| Liberians | 0.1 /100 | #290 | Tragic 17.0% |
| Immigrants | Congo | 0.1 /100 | #291 | Tragic 17.0% |
| Immigrants | Spain | 0.1 /100 | #292 | Tragic 17.0% |
| Bahamians | 0.1 /100 | #293 | Tragic 16.9% |
| Immigrants | Western Africa | 0.1 /100 | #294 | Tragic 16.9% |
| Immigrants | Russia | 0.1 /100 | #295 | Tragic 16.9% |
| Inupiat | 0.1 /100 | #296 | Tragic 16.9% |
| Israelis | 0.1 /100 | #297 | Tragic 16.8% |
| Immigrants | Zaire | 0.1 /100 | #298 | Tragic 16.7% |
Demographics Similar to Immigrants from South Eastern Asia by 3 or more Vehicles in Household
In terms of 3 or more vehicles in household, the demographic groups most similar to Immigrants from South Eastern Asia are Spanish (23.1%, a difference of 0.17%), English (23.1%, a difference of 0.19%), Lumbee (23.1%, a difference of 0.24%), Pueblo (23.0%, a difference of 0.28%), and Spanish American (23.0%, a difference of 0.34%).
| Demographics | Rating | Rank | 3 or more Vehicles in Household |
| Scandinavians | 100.0 /100 | #23 | Exceptional 23.6% |
| Sri Lankans | 100.0 /100 | #24 | Exceptional 23.6% |
| Immigrants | Central America | 100.0 /100 | #25 | Exceptional 23.4% |
| Mexican American Indians | 100.0 /100 | #26 | Exceptional 23.3% |
| Guamanians/Chamorros | 100.0 /100 | #27 | Exceptional 23.2% |
| Lumbee | 100.0 /100 | #28 | Exceptional 23.1% |
| Spanish | 100.0 /100 | #29 | Exceptional 23.1% |
| Immigrants | South Eastern Asia | 100.0 /100 | #30 | Exceptional 23.1% |
| English | 100.0 /100 | #31 | Exceptional 23.1% |
| Pueblo | 100.0 /100 | #32 | Exceptional 23.0% |
| Spanish Americans | 100.0 /100 | #33 | Exceptional 23.0% |
| Swiss | 100.0 /100 | #34 | Exceptional 23.0% |
| Choctaw | 100.0 /100 | #35 | Exceptional 23.0% |
| Cherokee | 100.0 /100 | #36 | Exceptional 23.0% |
| Swedes | 100.0 /100 | #37 | Exceptional 23.0% |