Indian (Asian) vs Finnish 4 or more Vehicles in Household

COMPARE

Indian (Asian)
Race
Ancestry
AfghanAfricanAlaska NativeAlaskan AthabascanAlbanianAleutAlsatianAmericanApacheArabArapahoArgentineanArmenianAssyrian/Chaldean/SyriacAustralianAustrianBahamianBangladeshiBarbadianBasqueBelgianBelizeanBermudanBhutaneseBlackfeetBolivianBrazilianBritishBritish West IndianBulgarianBurmeseCajunCambodianCanadianCape VerdeanCarpatho RusynCelticCentral AmericanCentral American IndianCherokeeCheyenneChickasawChileanChineseChippewaChoctawColombianColvilleComancheCosta RicanCreeCreekCroatianCrowCubanCypriotCzechCzechoslovakianDanishDelawareDominicanDutchDutch West IndianEastern EuropeanEcuadorianEgyptianEnglishEstonianEthiopianEuropeanFijianFilipinoFrenchFrench American IndianFrench CanadianGermanGerman RussianGhanaianGreekGuamanian/ChamorroGuatemalanGuyaneseHaitianHmongHonduranHopiHoumaHungarianIcelanderIndian (Asian)IndonesianInupiatIranianIraqiIrishIroquoisIsraeliItalianJamaicanJapaneseJordanianKenyanKiowaKoreanLaotianLatvianLebaneseLiberianLithuanianLumbeeLuxembourgerMacedonianMalaysianMalteseMarshalleseMenomineeMexicanMexican American IndianMongolianMoroccanNative HawaiianNavajoNepaleseNew ZealanderNicaraguanNigerianNorthern EuropeanNorwegianOkinawanOsageOttawaPaiutePakistaniPalestinianPanamanianParaguayanPennsylvania GermanPeruvianPimaPolishPortuguesePotawatomiPuebloPuerto RicanPuget Sound SalishRomanianRussianSalvadoranSamoanScandinavianScotch-IrishScottishSeminoleSenegaleseSerbianShoshoneSierra LeoneanSiouxSlavicSlovakSloveneSomaliSouth AfricanSouth AmericanSouth American IndianSoviet UnionSpaniardSpanishSpanish AmericanSpanish American IndianSri LankanSubsaharan AfricanSudaneseSwedishSwissSyrianTaiwaneseThaiTlingit-HaidaTohono O'OdhamTonganTrinidadian and TobagonianTsimshianTurkishU.S. Virgin IslanderUgandanUkrainianUruguayanUteVenezuelanVietnameseWelshWest IndianYakamaYaquiYugoslavianYumanYup'ikZimbabwean
Immigration
NonimmigrantsImmigrantsAfghanistanAfricaAlbaniaArgentinaArmeniaAsiaAustraliaAustriaBahamasBangladeshBarbadosBelarusBelgiumBelizeBoliviaBosnia and HerzegovinaBrazilBulgariaBurma/MyanmarCabo VerdeCambodiaCameroonCanadaCaribbeanCentral AmericaChileChinaColombiaCongoCosta RicaCroatiaCubaCzechoslovakiaDenmarkDominicaDominican RepublicEastern AfricaEastern AsiaEastern EuropeEcuadorEgyptEl SalvadorEnglandEritreaEthiopiaEuropeFijiFranceGermanyGhanaGreeceGrenadaGuatemalaGuyanaHaitiHondurasHong KongHungaryIndiaIndonesiaIranIraqIrelandIsraelItalyJamaicaJapanJordanKazakhstanKenyaKoreaKuwaitLaosLatin AmericaLatviaLebanonLiberiaLithuaniaMalaysiaMexicoMicronesiaMiddle AfricaMoldovaMoroccoNepalNetherlandsNicaraguaNigeriaNorth AmericaNorth MacedoniaNorthern AfricaNorthern EuropeNorwayOceaniaPakistanPanamaPeruPhilippinesPolandPortugalRomaniaRussiaSaudi ArabiaScotlandSenegalSerbiaSierra LeoneSingaporeSomaliaSouth AfricaSouth AmericaSouth Central AsiaSouth Eastern AsiaSouthern EuropeSpainSri LankaSt. Vincent and the GrenadinesSudanSwedenSwitzerlandSyriaTaiwanThailandTrinidad and TobagoTurkeyUgandaUkraineUruguayUzbekistanVenezuelaVietnamWest IndiesWestern AfricaWestern AsiaWestern EuropeYemenZaireZimbabweAzores
Finnish
Race
Ancestry
AfghanAfricanAlaska NativeAlaskan AthabascanAlbanianAleutAlsatianAmericanApacheArabArapahoArgentineanArmenianAssyrian/Chaldean/SyriacAustralianAustrianBahamianBangladeshiBarbadianBasqueBelgianBelizeanBermudanBhutaneseBlackfeetBolivianBrazilianBritishBritish West IndianBulgarianBurmeseCajunCambodianCanadianCape VerdeanCarpatho RusynCelticCentral AmericanCentral American IndianCherokeeCheyenneChickasawChileanChineseChippewaChoctawColombianColvilleComancheCosta RicanCreeCreekCroatianCrowCubanCypriotCzechCzechoslovakianDanishDelawareDominicanDutchDutch West IndianEastern EuropeanEcuadorianEgyptianEnglishEstonianEthiopianEuropeanFijianFilipinoFinnishFrenchFrench American IndianFrench CanadianGermanGerman RussianGhanaianGreekGuamanian/ChamorroGuatemalanGuyaneseHaitianHmongHonduranHopiHoumaHungarianIcelanderIndonesianInupiatIranianIraqiIrishIroquoisIsraeliItalianJamaicanJapaneseJordanianKenyanKiowaKoreanLaotianLatvianLebaneseLiberianLithuanianLumbeeLuxembourgerMacedonianMalaysianMalteseMarshalleseMenomineeMexicanMexican American IndianMongolianMoroccanNative HawaiianNavajoNepaleseNew ZealanderNicaraguanNigerianNorthern EuropeanNorwegianOkinawanOsageOttawaPaiutePakistaniPalestinianPanamanianParaguayanPennsylvania GermanPeruvianPimaPolishPortuguesePotawatomiPuebloPuerto RicanPuget Sound SalishRomanianRussianSalvadoranSamoanScandinavianScotch-IrishScottishSeminoleSenegaleseSerbianShoshoneSierra LeoneanSiouxSlavicSlovakSloveneSomaliSouth AfricanSouth AmericanSouth American IndianSoviet UnionSpaniardSpanishSpanish AmericanSpanish American IndianSri LankanSubsaharan AfricanSudaneseSwedishSwissSyrianTaiwaneseThaiTlingit-HaidaTohono O'OdhamTonganTrinidadian and TobagonianTsimshianTurkishU.S. Virgin IslanderUgandanUkrainianUruguayanUteVenezuelanVietnameseWelshWest IndianYakamaYaquiYugoslavianYumanYup'ikZimbabwean
Immigration
NonimmigrantsImmigrantsAfghanistanAfricaAlbaniaArgentinaArmeniaAsiaAustraliaAustriaBahamasBangladeshBarbadosBelarusBelgiumBelizeBoliviaBosnia and HerzegovinaBrazilBulgariaBurma/MyanmarCabo VerdeCambodiaCameroonCanadaCaribbeanCentral AmericaChileChinaColombiaCongoCosta RicaCroatiaCubaCzechoslovakiaDenmarkDominicaDominican RepublicEastern AfricaEastern AsiaEastern EuropeEcuadorEgyptEl SalvadorEnglandEritreaEthiopiaEuropeFijiFranceGermanyGhanaGreeceGrenadaGuatemalaGuyanaHaitiHondurasHong KongHungaryIndiaIndonesiaIranIraqIrelandIsraelItalyJamaicaJapanJordanKazakhstanKenyaKoreaKuwaitLaosLatin AmericaLatviaLebanonLiberiaLithuaniaMalaysiaMexicoMicronesiaMiddle AfricaMoldovaMoroccoNepalNetherlandsNicaraguaNigeriaNorth AmericaNorth MacedoniaNorthern AfricaNorthern EuropeNorwayOceaniaPakistanPanamaPeruPhilippinesPolandPortugalRomaniaRussiaSaudi ArabiaScotlandSenegalSerbiaSierra LeoneSingaporeSomaliaSouth AfricaSouth AmericaSouth Central AsiaSouth Eastern AsiaSouthern EuropeSpainSri LankaSt. Vincent and the GrenadinesSudanSwedenSwitzerlandSyriaTaiwanThailandTrinidad and TobagoTurkeyUgandaUkraineUruguayUzbekistanVenezuelaVietnamWest IndiesWestern AfricaWestern AsiaWestern EuropeYemenZaireZimbabweAzores
4 or more Vehicles in Household
Income
Poverty
Unemployment
Labor Participation
Family Structure
Vehicle Availability
Education Level
Disability

4 or more Vehicles in Household Comparison

Indians (Asian)

Finns

Good
Exceptional
6.4%
4 OR MORE VEHICLES IN HOUSEHOLD
66.3/ 100
METRIC RATING
159th/ 347
METRIC RANK
7.3%
4 OR MORE VEHICLES IN HOUSEHOLD
99.8/ 100
METRIC RATING
81st/ 347
METRIC RANK

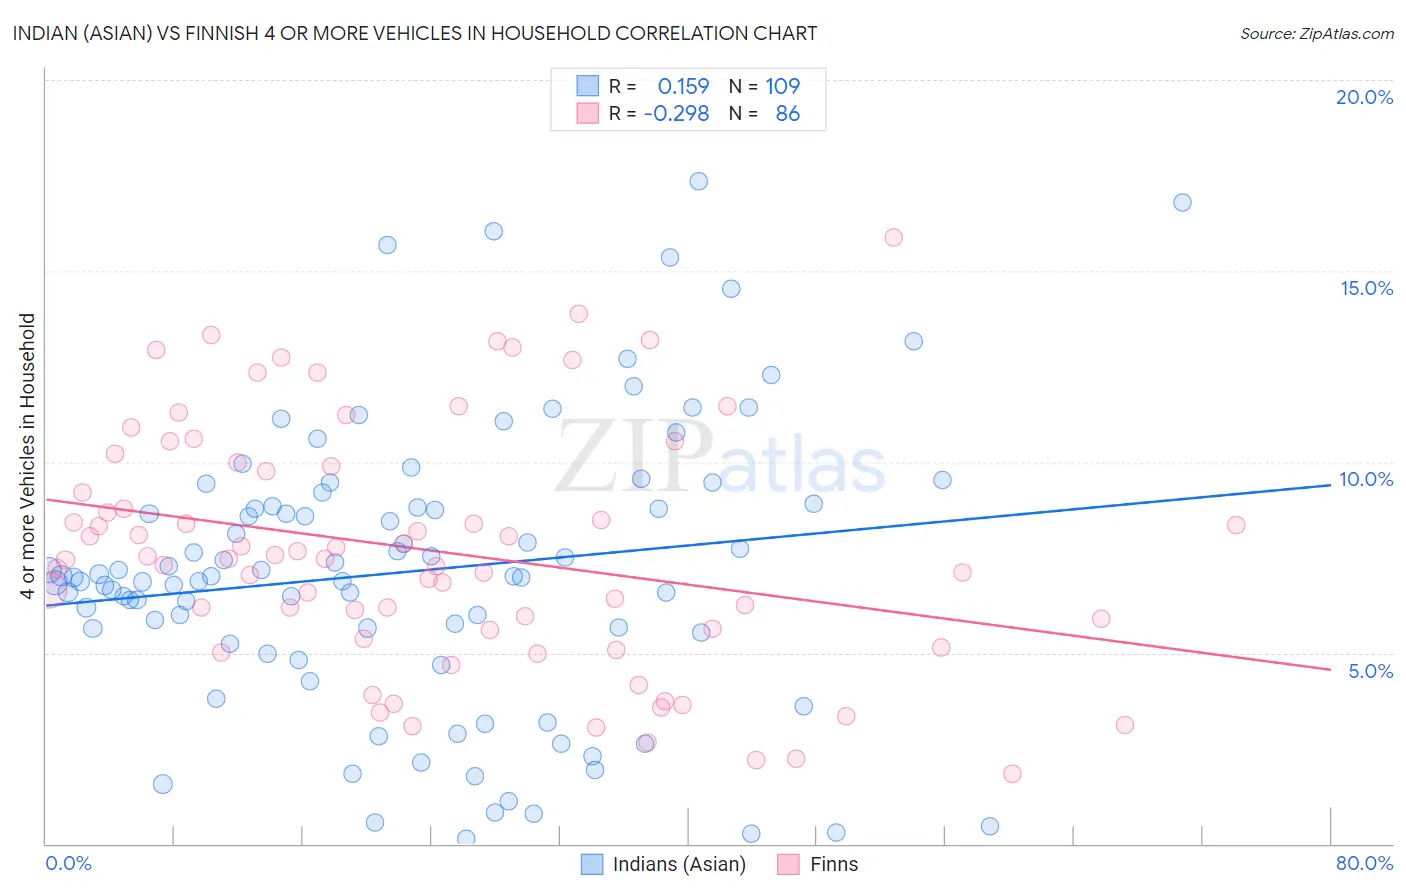
Indian (Asian) vs Finnish 4 or more Vehicles in Household Correlation Chart

The statistical analysis conducted on geographies consisting of 492,569,757 people shows a poor positive correlation between the proportion of Indians (Asian) and percentage of households with 4 or more vehicles available in the United States with a correlation coefficient (R) of 0.159 and weighted average of 6.4%. Similarly, the statistical analysis conducted on geographies consisting of 403,293,197 people shows a weak negative correlation between the proportion of Finns and percentage of households with 4 or more vehicles available in the United States with a correlation coefficient (R) of -0.298 and weighted average of 7.3%, a difference of 13.5%.
Indian (Asian) vs Finnish 4 or more Vehicles in Household

4 or more Vehicles in Household Correlation Summary

MeasurementIndian (Asian)Finnish
Minimum0.12%1.8%
Maximum17.4%15.9%
Range17.2%14.0%
Mean7.1%7.7%
Median7.0%7.5%
Interquartile 25% (IQ1)5.4%5.6%
Interquartile 75% (IQ3)8.9%9.9%
Interquartile Range (IQR)3.5%4.3%
Standard Deviation (Sample)3.7%3.2%
Standard Deviation (Population)3.7%3.1%

Similar Demographics by 4 or more Vehicles in Household

Demographics Similar to Indians (Asian) by 4 or more Vehicles in Household

In terms of 4 or more vehicles in household, the demographic groups most similar to Indians (Asian) are Palestinian (6.4%, a difference of 0.050%), Zimbabwean (6.4%, a difference of 0.090%), Immigrants from Cameroon (6.4%, a difference of 0.21%), Immigrants from Pakistan (6.4%, a difference of 0.33%), and Peruvian (6.5%, a difference of 0.36%).
DemographicsRating | Rank4 or more Vehicles in Household
Yuman
72.1
/100
|
#152
Good
6.5%
Immigrants | Armenia
71.2
/100
|
#153
Good
6.5%
Central American Indians
71.1
/100
|
#154
Good
6.5%
Iroquois
70.4
/100
|
#155
Good
6.5%
Iranians
69.9
/100
|
#156
Good
6.5%
Peruvians
69.4
/100
|
#157
Good
6.5%
Zimbabweans
67.1
/100
|
#158
Good
6.4%
Indians (Asian)
66.3
/100
|
#159
Good
6.4%
Palestinians
65.8
/100
|
#160
Good
6.4%
Immigrants | Cameroon
64.4
/100
|
#161
Good
6.4%
Immigrants | Pakistan
63.2
/100
|
#162
Good
6.4%
Chileans
61.2
/100
|
#163
Good
6.4%
Hungarians
61.1
/100
|
#164
Good
6.4%
Immigrants | Peru
59.8
/100
|
#165
Average
6.4%
Immigrants | Denmark
57.8
/100
|
#166
Average
6.4%

Demographics Similar to Finns by 4 or more Vehicles in Household

In terms of 4 or more vehicles in household, the demographic groups most similar to Finns are Northern European (7.3%, a difference of 0.20%), Potawatomi (7.3%, a difference of 0.32%), Alaska Native (7.3%, a difference of 0.56%), Afghan (7.3%, a difference of 0.65%), and Czech (7.4%, a difference of 0.70%).
DemographicsRating | Rank4 or more Vehicles in Household
Icelanders
99.9
/100
|
#74
Exceptional
7.4%
Immigrants | Cambodia
99.9
/100
|
#75
Exceptional
7.4%
Laotians
99.9
/100
|
#76
Exceptional
7.4%
Apache
99.9
/100
|
#77
Exceptional
7.4%
Whites/Caucasians
99.8
/100
|
#78
Exceptional
7.4%
Czechs
99.8
/100
|
#79
Exceptional
7.4%
Alaska Natives
99.8
/100
|
#80
Exceptional
7.3%
Finns
99.8
/100
|
#81
Exceptional
7.3%
Northern Europeans
99.8
/100
|
#82
Exceptional
7.3%
Potawatomi
99.7
/100
|
#83
Exceptional
7.3%
Afghans
99.7
/100
|
#84
Exceptional
7.3%
Cree
99.7
/100
|
#85
Exceptional
7.2%
Immigrants | Indonesia
99.6
/100
|
#86
Exceptional
7.2%
Delaware
99.6
/100
|
#87
Exceptional
7.2%
Immigrants | Nonimmigrants
99.6
/100
|
#88
Exceptional
7.2%