Indian (Asian) vs Finnish 3rd Grade
COMPARE
Indian (Asian)
Finnish
3rd Grade
3rd Grade Comparison
Indians (Asian)
Finns
97.4%
3RD GRADE
1.3/ 100
METRIC RATING
243rd/ 347
METRIC RANK
98.5%
3RD GRADE
100.0/ 100
METRIC RATING
22nd/ 347
METRIC RANK
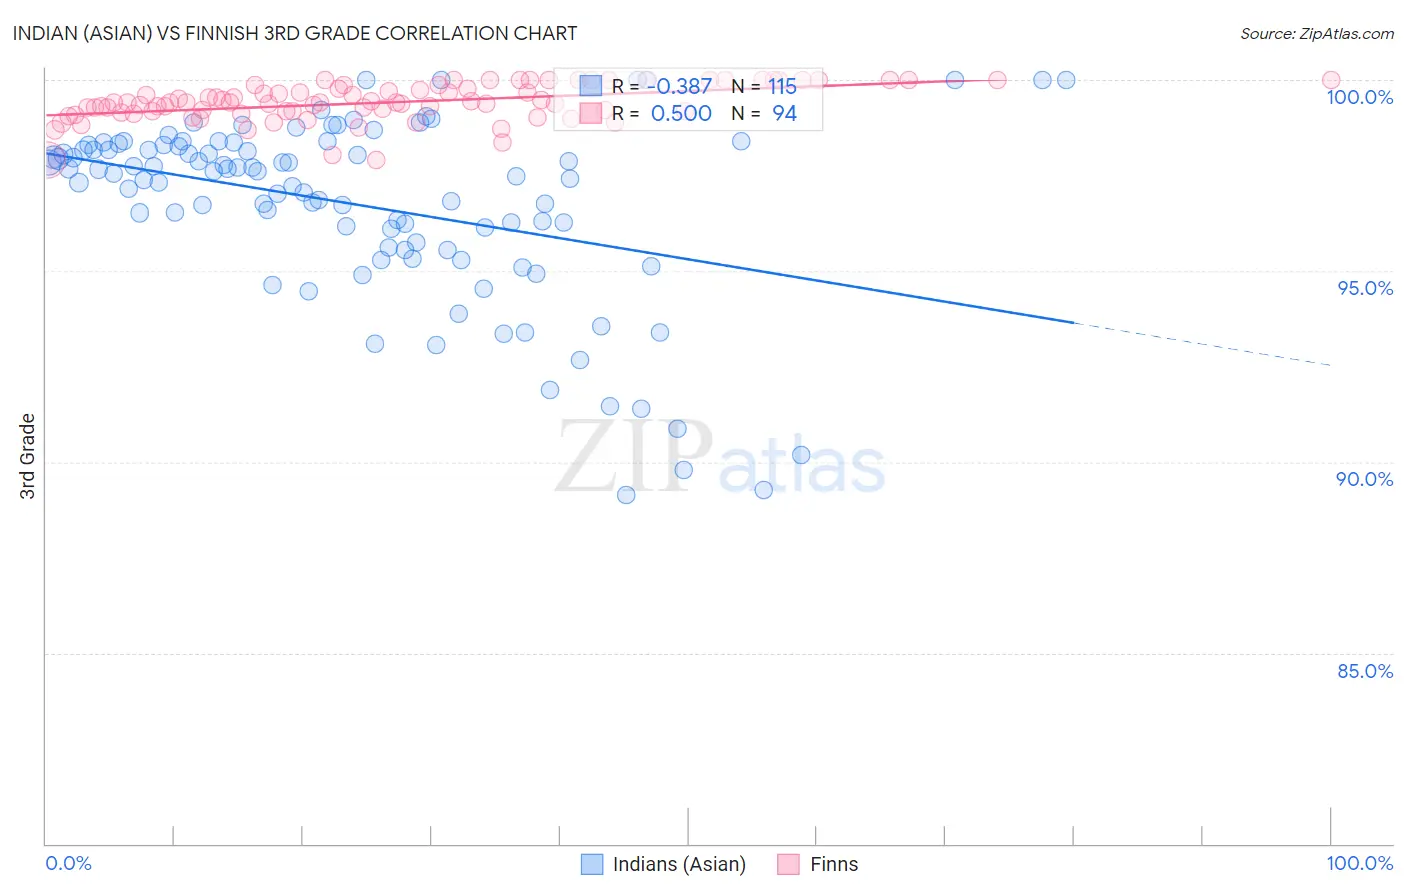
Indian (Asian) vs Finnish 3rd Grade Correlation Chart
The statistical analysis conducted on geographies consisting of 495,196,037 people shows a mild negative correlation between the proportion of Indians (Asian) and percentage of population with at least 3rd grade education in the United States with a correlation coefficient (R) of -0.387 and weighted average of 97.4%. Similarly, the statistical analysis conducted on geographies consisting of 404,675,516 people shows a substantial positive correlation between the proportion of Finns and percentage of population with at least 3rd grade education in the United States with a correlation coefficient (R) of 0.500 and weighted average of 98.5%, a difference of 1.1%.
3rd Grade Correlation Summary
| Measurement | Indian (Asian) | Finnish |
| Minimum | 89.1% | 97.9% |
| Maximum | 100.0% | 100.0% |
| Range | 10.9% | 2.1% |
| Mean | 96.7% | 99.4% |
| Median | 97.5% | 99.4% |
| Interquartile 25% (IQ1) | 95.6% | 99.2% |
| Interquartile 75% (IQ3) | 98.3% | 99.9% |
| Interquartile Range (IQR) | 2.7% | 0.70% |
| Standard Deviation (Sample) | 2.4% | 0.48% |
| Standard Deviation (Population) | 2.4% | 0.48% |
Similar Demographics by 3rd Grade
Demographics Similar to Indians (Asian) by 3rd Grade
In terms of 3rd grade, the demographic groups most similar to Indians (Asian) are U.S. Virgin Islander (97.4%, a difference of 0.010%), Immigrants from Indonesia (97.4%, a difference of 0.010%), Korean (97.4%, a difference of 0.010%), Asian (97.4%, a difference of 0.010%), and Ethiopian (97.4%, a difference of 0.010%).
| Demographics | Rating | Rank | 3rd Grade |
| Liberians | 1.8 /100 | #236 | Tragic 97.4% |
| Colombians | 1.8 /100 | #237 | Tragic 97.4% |
| Immigrants | Uruguay | 1.7 /100 | #238 | Tragic 97.4% |
| Nigerians | 1.6 /100 | #239 | Tragic 97.4% |
| U.S. Virgin Islanders | 1.4 /100 | #240 | Tragic 97.4% |
| Immigrants | Indonesia | 1.4 /100 | #241 | Tragic 97.4% |
| Koreans | 1.3 /100 | #242 | Tragic 97.4% |
| Indians (Asian) | 1.3 /100 | #243 | Tragic 97.4% |
| Asians | 1.1 /100 | #244 | Tragic 97.4% |
| Ethiopians | 1.1 /100 | #245 | Tragic 97.4% |
| Immigrants | Senegal | 1.0 /100 | #246 | Tragic 97.4% |
| Assyrians/Chaldeans/Syriacs | 1.0 /100 | #247 | Tragic 97.4% |
| Immigrants | Eastern Africa | 0.9 /100 | #248 | Tragic 97.4% |
| South Americans | 0.9 /100 | #249 | Tragic 97.4% |
| Immigrants | Middle Africa | 0.9 /100 | #250 | Tragic 97.4% |
Demographics Similar to Finns by 3rd Grade
In terms of 3rd grade, the demographic groups most similar to Finns are Lithuanian (98.5%, a difference of 0.0%), Sioux (98.5%, a difference of 0.0%), Polish (98.5%, a difference of 0.010%), Pennsylvania German (98.5%, a difference of 0.010%), and Danish (98.5%, a difference of 0.010%).
| Demographics | Rating | Rank | 3rd Grade |
| Swedes | 100.0 /100 | #15 | Exceptional 98.5% |
| Scottish | 100.0 /100 | #16 | Exceptional 98.5% |
| Dutch | 100.0 /100 | #17 | Exceptional 98.5% |
| Irish | 100.0 /100 | #18 | Exceptional 98.5% |
| Poles | 100.0 /100 | #19 | Exceptional 98.5% |
| Pennsylvania Germans | 100.0 /100 | #20 | Exceptional 98.5% |
| Lithuanians | 100.0 /100 | #21 | Exceptional 98.5% |
| Finns | 100.0 /100 | #22 | Exceptional 98.5% |
| Sioux | 100.0 /100 | #23 | Exceptional 98.5% |
| Danes | 100.0 /100 | #24 | Exceptional 98.5% |
| Scotch-Irish | 100.0 /100 | #25 | Exceptional 98.5% |
| Aleuts | 100.0 /100 | #26 | Exceptional 98.5% |
| Croatians | 100.0 /100 | #27 | Exceptional 98.5% |
| French | 100.0 /100 | #28 | Exceptional 98.4% |
| French Canadians | 100.0 /100 | #29 | Exceptional 98.4% |