Indian (Asian) vs Immigrants from Trinidad and Tobago 4 or more Vehicles in Household
COMPARE
Indian (Asian)
Immigrants from Trinidad and Tobago
4 or more Vehicles in Household
4 or more Vehicles in Household Comparison
Indians (Asian)
Immigrants from Trinidad and Tobago
6.4%
4 OR MORE VEHICLES IN HOUSEHOLD
66.3/ 100
METRIC RATING
159th/ 347
METRIC RANK
4.1%
4 OR MORE VEHICLES IN HOUSEHOLD
0.0/ 100
METRIC RATING
334th/ 347
METRIC RANK
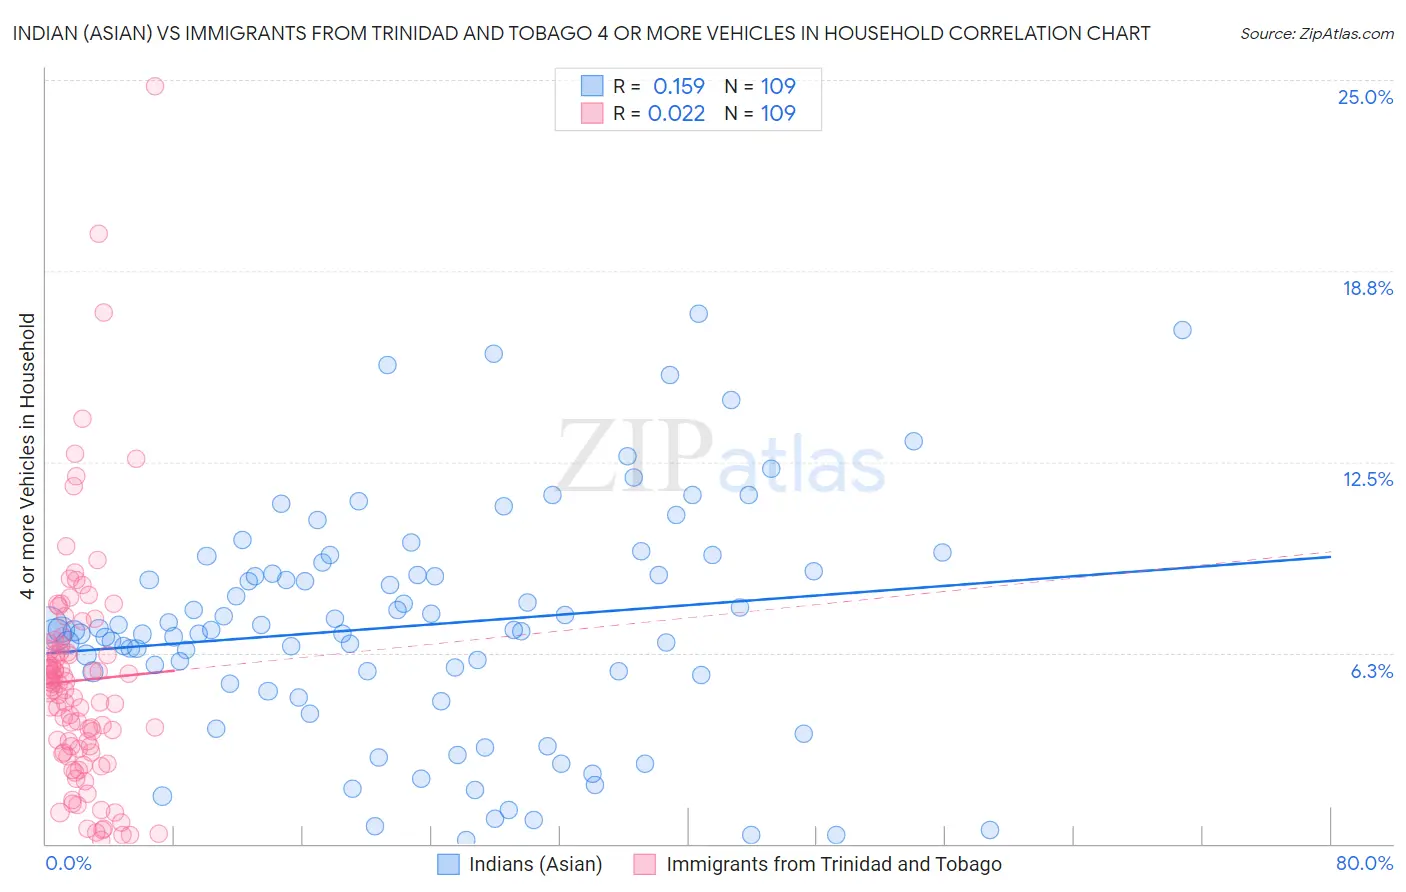
Indian (Asian) vs Immigrants from Trinidad and Tobago 4 or more Vehicles in Household Correlation Chart
The statistical analysis conducted on geographies consisting of 492,569,757 people shows a poor positive correlation between the proportion of Indians (Asian) and percentage of households with 4 or more vehicles available in the United States with a correlation coefficient (R) of 0.159 and weighted average of 6.4%. Similarly, the statistical analysis conducted on geographies consisting of 222,352,936 people shows no correlation between the proportion of Immigrants from Trinidad and Tobago and percentage of households with 4 or more vehicles available in the United States with a correlation coefficient (R) of 0.022 and weighted average of 4.1%, a difference of 56.7%.
4 or more Vehicles in Household Correlation Summary
| Measurement | Indian (Asian) | Immigrants from Trinidad and Tobago |
| Minimum | 0.12% | 0.11% |
| Maximum | 17.4% | 24.8% |
| Range | 17.2% | 24.7% |
| Mean | 7.1% | 5.3% |
| Median | 7.0% | 5.0% |
| Interquartile 25% (IQ1) | 5.4% | 3.0% |
| Interquartile 75% (IQ3) | 8.9% | 6.4% |
| Interquartile Range (IQR) | 3.5% | 3.4% |
| Standard Deviation (Sample) | 3.7% | 3.9% |
| Standard Deviation (Population) | 3.7% | 3.9% |
Similar Demographics by 4 or more Vehicles in Household
Demographics Similar to Indians (Asian) by 4 or more Vehicles in Household
In terms of 4 or more vehicles in household, the demographic groups most similar to Indians (Asian) are Palestinian (6.4%, a difference of 0.050%), Zimbabwean (6.4%, a difference of 0.090%), Immigrants from Cameroon (6.4%, a difference of 0.21%), Immigrants from Pakistan (6.4%, a difference of 0.33%), and Peruvian (6.5%, a difference of 0.36%).
| Demographics | Rating | Rank | 4 or more Vehicles in Household |
| Yuman | 72.1 /100 | #152 | Good 6.5% |
| Immigrants | Armenia | 71.2 /100 | #153 | Good 6.5% |
| Central American Indians | 71.1 /100 | #154 | Good 6.5% |
| Iroquois | 70.4 /100 | #155 | Good 6.5% |
| Iranians | 69.9 /100 | #156 | Good 6.5% |
| Peruvians | 69.4 /100 | #157 | Good 6.5% |
| Zimbabweans | 67.1 /100 | #158 | Good 6.4% |
| Indians (Asian) | 66.3 /100 | #159 | Good 6.4% |
| Palestinians | 65.8 /100 | #160 | Good 6.4% |
| Immigrants | Cameroon | 64.4 /100 | #161 | Good 6.4% |
| Immigrants | Pakistan | 63.2 /100 | #162 | Good 6.4% |
| Chileans | 61.2 /100 | #163 | Good 6.4% |
| Hungarians | 61.1 /100 | #164 | Good 6.4% |
| Immigrants | Peru | 59.8 /100 | #165 | Average 6.4% |
| Immigrants | Denmark | 57.8 /100 | #166 | Average 6.4% |
Demographics Similar to Immigrants from Trinidad and Tobago by 4 or more Vehicles in Household
In terms of 4 or more vehicles in household, the demographic groups most similar to Immigrants from Trinidad and Tobago are Immigrants from Albania (4.1%, a difference of 0.21%), Immigrants from Dominica (4.2%, a difference of 1.9%), West Indian (4.2%, a difference of 2.8%), Immigrants from Ecuador (4.2%, a difference of 3.1%), and Immigrants from Senegal (4.2%, a difference of 3.3%).
| Demographics | Rating | Rank | 4 or more Vehicles in Household |
| Senegalese | 0.0 /100 | #327 | Tragic 4.3% |
| Trinidadians and Tobagonians | 0.0 /100 | #328 | Tragic 4.3% |
| Immigrants | Senegal | 0.0 /100 | #329 | Tragic 4.2% |
| Immigrants | Ecuador | 0.0 /100 | #330 | Tragic 4.2% |
| West Indians | 0.0 /100 | #331 | Tragic 4.2% |
| Immigrants | Dominica | 0.0 /100 | #332 | Tragic 4.2% |
| Immigrants | Albania | 0.0 /100 | #333 | Tragic 4.1% |
| Immigrants | Trinidad and Tobago | 0.0 /100 | #334 | Tragic 4.1% |
| Barbadians | 0.0 /100 | #335 | Tragic 3.9% |
| Immigrants | Bangladesh | 0.0 /100 | #336 | Tragic 3.9% |
| Vietnamese | 0.0 /100 | #337 | Tragic 3.9% |
| Immigrants | Cabo Verde | 0.0 /100 | #338 | Tragic 3.8% |
| Immigrants | Uzbekistan | 0.0 /100 | #339 | Tragic 3.6% |
| Immigrants | Barbados | 0.0 /100 | #340 | Tragic 3.6% |
| Dominicans | 0.0 /100 | #341 | Tragic 3.5% |