Indian (Asian) vs Finnish In Labor Force | Age 20-64
COMPARE
Indian (Asian)
Finnish
In Labor Force | Age 20-64
In Labor Force | Age 20-64 Comparison
Indians (Asian)
Finns
79.9%
IN LABOR FORCE | AGE 20-64
87.7/ 100
METRIC RATING
132nd/ 347
METRIC RANK
79.5%
IN LABOR FORCE | AGE 20-64
35.9/ 100
METRIC RATING
184th/ 347
METRIC RANK
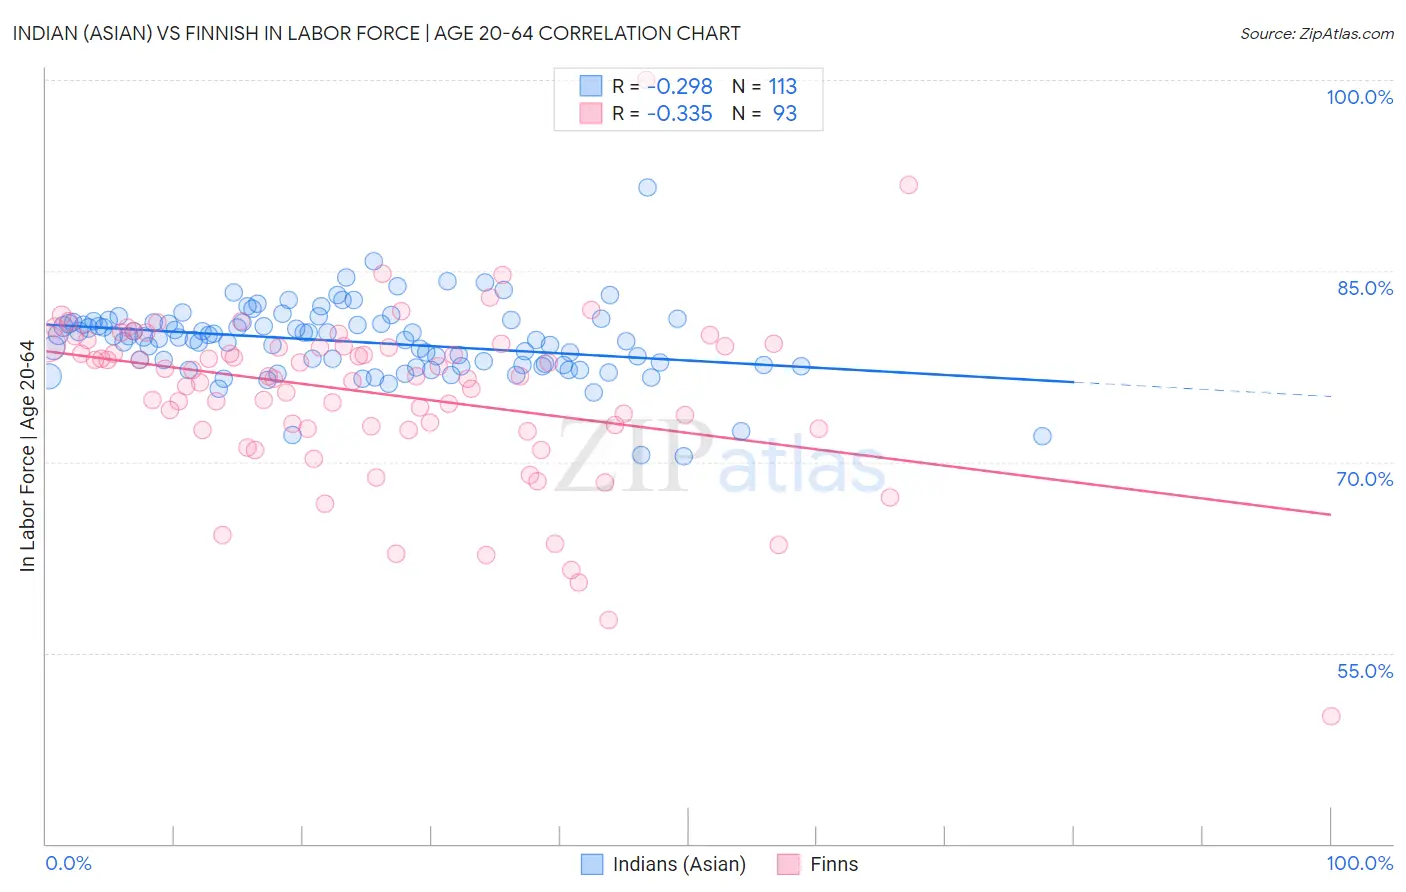
Indian (Asian) vs Finnish In Labor Force | Age 20-64 Correlation Chart
The statistical analysis conducted on geographies consisting of 495,369,997 people shows a weak negative correlation between the proportion of Indians (Asian) and labor force participation rate among population between the ages 20 and 64 in the United States with a correlation coefficient (R) of -0.298 and weighted average of 79.9%. Similarly, the statistical analysis conducted on geographies consisting of 404,683,830 people shows a mild negative correlation between the proportion of Finns and labor force participation rate among population between the ages 20 and 64 in the United States with a correlation coefficient (R) of -0.335 and weighted average of 79.5%, a difference of 0.51%.
In Labor Force | Age 20-64 Correlation Summary
| Measurement | Indian (Asian) | Finnish |
| Minimum | 70.4% | 50.0% |
| Maximum | 91.6% | 100.0% |
| Range | 21.2% | 50.0% |
| Mean | 79.5% | 75.4% |
| Median | 79.8% | 76.7% |
| Interquartile 25% (IQ1) | 77.6% | 72.6% |
| Interquartile 75% (IQ3) | 81.0% | 79.2% |
| Interquartile Range (IQR) | 3.3% | 6.5% |
| Standard Deviation (Sample) | 3.0% | 6.9% |
| Standard Deviation (Population) | 2.9% | 6.8% |
Similar Demographics by In Labor Force | Age 20-64
Demographics Similar to Indians (Asian) by In Labor Force | Age 20-64
In terms of in labor force | age 20-64, the demographic groups most similar to Indians (Asian) are South American Indian (79.9%, a difference of 0.0%), Belgian (79.9%, a difference of 0.0%), Immigrants from Iran (79.9%, a difference of 0.010%), Italian (79.9%, a difference of 0.020%), and Immigrants from Zaire (79.9%, a difference of 0.020%).
| Demographics | Rating | Rank | In Labor Force | Age 20-64 |
| Danes | 91.5 /100 | #125 | Exceptional 79.9% |
| Immigrants | France | 90.7 /100 | #126 | Exceptional 79.9% |
| Immigrants | Czechoslovakia | 89.7 /100 | #127 | Excellent 79.9% |
| Immigrants | Eastern Asia | 89.4 /100 | #128 | Excellent 79.9% |
| Italians | 88.9 /100 | #129 | Excellent 79.9% |
| Immigrants | Zaire | 88.6 /100 | #130 | Excellent 79.9% |
| Immigrants | Iran | 88.3 /100 | #131 | Excellent 79.9% |
| Indians (Asian) | 87.7 /100 | #132 | Excellent 79.9% |
| South American Indians | 87.6 /100 | #133 | Excellent 79.9% |
| Belgians | 87.4 /100 | #134 | Excellent 79.9% |
| Ukrainians | 86.8 /100 | #135 | Excellent 79.9% |
| Immigrants | Singapore | 86.7 /100 | #136 | Excellent 79.9% |
| Immigrants | Ukraine | 86.5 /100 | #137 | Excellent 79.9% |
| Immigrants | Nigeria | 86.4 /100 | #138 | Excellent 79.9% |
| Immigrants | Spain | 83.9 /100 | #139 | Excellent 79.8% |
Demographics Similar to Finns by In Labor Force | Age 20-64
In terms of in labor force | age 20-64, the demographic groups most similar to Finns are Malaysian (79.5%, a difference of 0.010%), Immigrants from Hungary (79.5%, a difference of 0.010%), Israeli (79.5%, a difference of 0.010%), Northern European (79.5%, a difference of 0.010%), and Immigrants from Saudi Arabia (79.5%, a difference of 0.020%).
| Demographics | Rating | Rank | In Labor Force | Age 20-64 |
| Immigrants | Netherlands | 45.2 /100 | #177 | Average 79.5% |
| Czechoslovakians | 44.3 /100 | #178 | Average 79.5% |
| Armenians | 41.4 /100 | #179 | Average 79.5% |
| Salvadorans | 41.0 /100 | #180 | Average 79.5% |
| Immigrants | Saudi Arabia | 37.7 /100 | #181 | Fair 79.5% |
| Malaysians | 37.1 /100 | #182 | Fair 79.5% |
| Immigrants | Hungary | 36.8 /100 | #183 | Fair 79.5% |
| Finns | 35.9 /100 | #184 | Fair 79.5% |
| Israelis | 34.7 /100 | #185 | Fair 79.5% |
| Northern Europeans | 34.5 /100 | #186 | Fair 79.5% |
| Assyrians/Chaldeans/Syriacs | 33.3 /100 | #187 | Fair 79.4% |
| Immigrants | Haiti | 32.1 /100 | #188 | Fair 79.4% |
| Immigrants | El Salvador | 30.9 /100 | #189 | Fair 79.4% |
| Immigrants | Syria | 30.8 /100 | #190 | Fair 79.4% |
| Swiss | 28.9 /100 | #191 | Fair 79.4% |