Immigrants from Korea vs Finnish 4 or more Vehicles in Household
COMPARE
Immigrants from Korea
Finnish
4 or more Vehicles in Household
4 or more Vehicles in Household Comparison
Immigrants from Korea
Finns
6.8%
4 OR MORE VEHICLES IN HOUSEHOLD
93.8/ 100
METRIC RATING
127th/ 347
METRIC RANK
7.3%
4 OR MORE VEHICLES IN HOUSEHOLD
99.8/ 100
METRIC RATING
81st/ 347
METRIC RANK
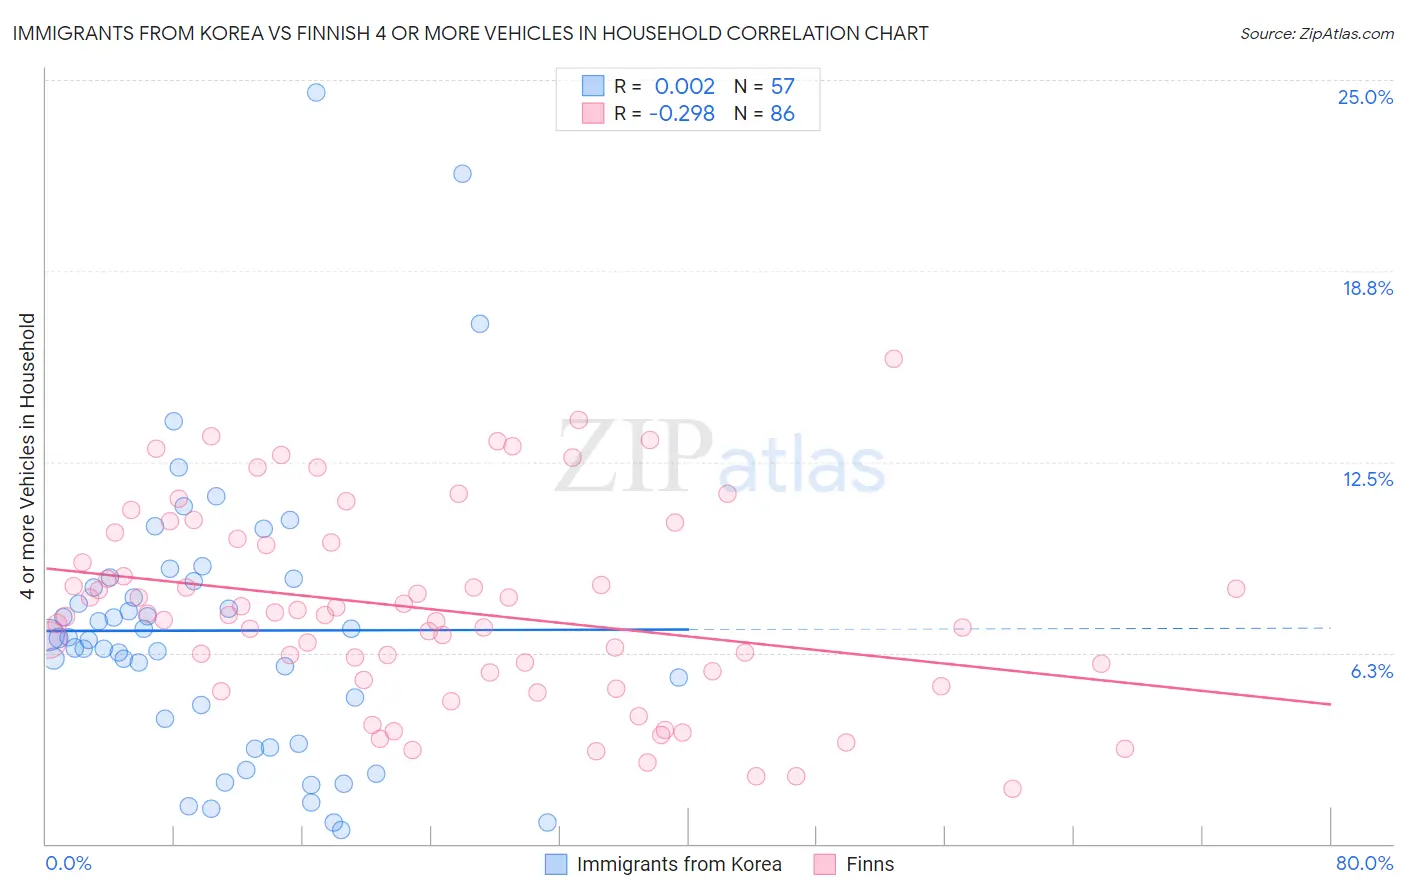
Immigrants from Korea vs Finnish 4 or more Vehicles in Household Correlation Chart
The statistical analysis conducted on geographies consisting of 414,077,591 people shows no correlation between the proportion of Immigrants from Korea and percentage of households with 4 or more vehicles available in the United States with a correlation coefficient (R) of 0.002 and weighted average of 6.8%. Similarly, the statistical analysis conducted on geographies consisting of 403,293,197 people shows a weak negative correlation between the proportion of Finns and percentage of households with 4 or more vehicles available in the United States with a correlation coefficient (R) of -0.298 and weighted average of 7.3%, a difference of 8.0%.
4 or more Vehicles in Household Correlation Summary
| Measurement | Immigrants from Korea | Finnish |
| Minimum | 0.44% | 1.8% |
| Maximum | 24.6% | 15.9% |
| Range | 24.1% | 14.0% |
| Mean | 7.0% | 7.7% |
| Median | 6.7% | 7.5% |
| Interquartile 25% (IQ1) | 3.7% | 5.6% |
| Interquartile 75% (IQ3) | 8.6% | 9.9% |
| Interquartile Range (IQR) | 5.0% | 4.3% |
| Standard Deviation (Sample) | 4.7% | 3.2% |
| Standard Deviation (Population) | 4.6% | 3.1% |
Similar Demographics by 4 or more Vehicles in Household
Demographics Similar to Immigrants from Korea by 4 or more Vehicles in Household
In terms of 4 or more vehicles in household, the demographic groups most similar to Immigrants from Korea are Belgian (6.8%, a difference of 0.12%), Austrian (6.8%, a difference of 0.13%), Immigrants from Asia (6.8%, a difference of 0.23%), Immigrants (6.8%, a difference of 0.33%), and Immigrants from Germany (6.8%, a difference of 0.39%).
| Demographics | Rating | Rank | 4 or more Vehicles in Household |
| Comanche | 94.8 /100 | #120 | Exceptional 6.8% |
| Immigrants | Germany | 94.7 /100 | #121 | Exceptional 6.8% |
| Immigrants | Nicaragua | 94.7 /100 | #122 | Exceptional 6.8% |
| Immigrants | Immigrants | 94.6 /100 | #123 | Exceptional 6.8% |
| Immigrants | Asia | 94.4 /100 | #124 | Exceptional 6.8% |
| Austrians | 94.1 /100 | #125 | Exceptional 6.8% |
| Belgians | 94.1 /100 | #126 | Exceptional 6.8% |
| Immigrants | Korea | 93.8 /100 | #127 | Exceptional 6.8% |
| Immigrants | Bolivia | 92.5 /100 | #128 | Exceptional 6.7% |
| Immigrants | England | 92.0 /100 | #129 | Exceptional 6.7% |
| Immigrants | Scotland | 89.0 /100 | #130 | Excellent 6.7% |
| Maltese | 88.4 /100 | #131 | Excellent 6.7% |
| Immigrants | Netherlands | 87.8 /100 | #132 | Excellent 6.6% |
| Armenians | 86.9 /100 | #133 | Excellent 6.6% |
| Ottawa | 86.9 /100 | #134 | Excellent 6.6% |
Demographics Similar to Finns by 4 or more Vehicles in Household
In terms of 4 or more vehicles in household, the demographic groups most similar to Finns are Northern European (7.3%, a difference of 0.20%), Potawatomi (7.3%, a difference of 0.32%), Alaska Native (7.3%, a difference of 0.56%), Afghan (7.3%, a difference of 0.65%), and Czech (7.4%, a difference of 0.70%).
| Demographics | Rating | Rank | 4 or more Vehicles in Household |
| Icelanders | 99.9 /100 | #74 | Exceptional 7.4% |
| Immigrants | Cambodia | 99.9 /100 | #75 | Exceptional 7.4% |
| Laotians | 99.9 /100 | #76 | Exceptional 7.4% |
| Apache | 99.9 /100 | #77 | Exceptional 7.4% |
| Whites/Caucasians | 99.8 /100 | #78 | Exceptional 7.4% |
| Czechs | 99.8 /100 | #79 | Exceptional 7.4% |
| Alaska Natives | 99.8 /100 | #80 | Exceptional 7.3% |
| Finns | 99.8 /100 | #81 | Exceptional 7.3% |
| Northern Europeans | 99.8 /100 | #82 | Exceptional 7.3% |
| Potawatomi | 99.7 /100 | #83 | Exceptional 7.3% |
| Afghans | 99.7 /100 | #84 | Exceptional 7.3% |
| Cree | 99.7 /100 | #85 | Exceptional 7.2% |
| Immigrants | Indonesia | 99.6 /100 | #86 | Exceptional 7.2% |
| Delaware | 99.6 /100 | #87 | Exceptional 7.2% |
| Immigrants | Nonimmigrants | 99.6 /100 | #88 | Exceptional 7.2% |