Indian (Asian) vs Finnish Seniors Poverty Over the Age of 75
COMPARE
Indian (Asian)
Finnish
Seniors Poverty Over the Age of 75
Seniors Poverty Over the Age of 75 Comparison
Indians (Asian)
Finns
12.7%
SENIORS POVERTY OVER THE AGE OF 75
9.7/ 100
METRIC RATING
205th/ 347
METRIC RANK
10.8%
SENIORS POVERTY OVER THE AGE OF 75
99.6/ 100
METRIC RATING
38th/ 347
METRIC RANK
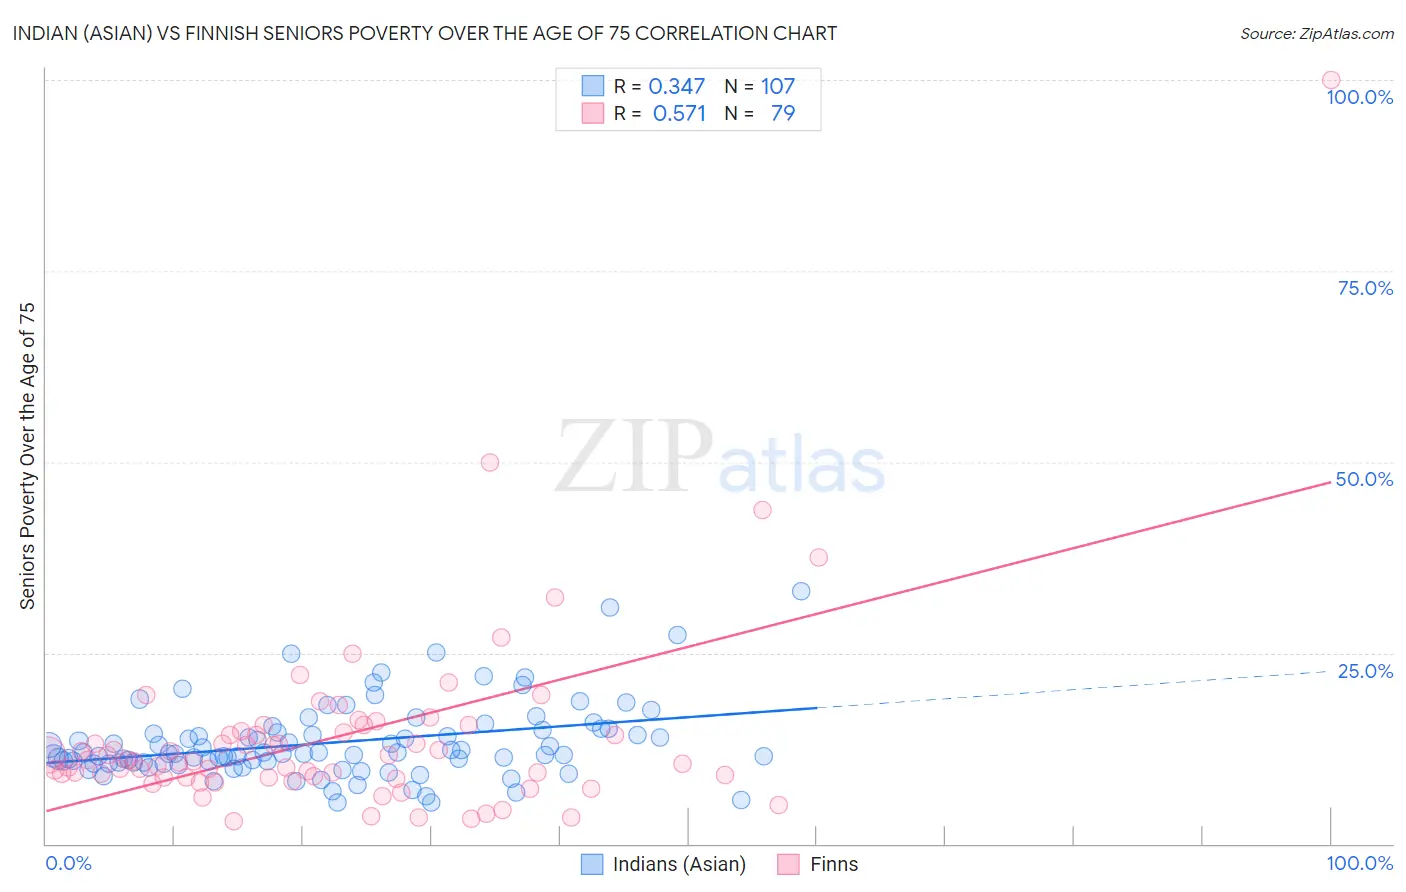
Indian (Asian) vs Finnish Seniors Poverty Over the Age of 75 Correlation Chart
The statistical analysis conducted on geographies consisting of 486,315,330 people shows a mild positive correlation between the proportion of Indians (Asian) and poverty level among seniors over the age of 75 in the United States with a correlation coefficient (R) of 0.347 and weighted average of 12.7%. Similarly, the statistical analysis conducted on geographies consisting of 398,908,643 people shows a substantial positive correlation between the proportion of Finns and poverty level among seniors over the age of 75 in the United States with a correlation coefficient (R) of 0.571 and weighted average of 10.8%, a difference of 17.5%.
Seniors Poverty Over the Age of 75 Correlation Summary
| Measurement | Indian (Asian) | Finnish |
| Minimum | 5.3% | 2.9% |
| Maximum | 33.1% | 100.0% |
| Range | 27.8% | 97.1% |
| Mean | 13.3% | 13.9% |
| Median | 11.8% | 10.8% |
| Interquartile 25% (IQ1) | 10.6% | 8.6% |
| Interquartile 75% (IQ3) | 14.9% | 14.6% |
| Interquartile Range (IQR) | 4.2% | 6.0% |
| Standard Deviation (Sample) | 5.0% | 12.8% |
| Standard Deviation (Population) | 5.0% | 12.7% |
Similar Demographics by Seniors Poverty Over the Age of 75
Demographics Similar to Indians (Asian) by Seniors Poverty Over the Age of 75
In terms of seniors poverty over the age of 75, the demographic groups most similar to Indians (Asian) are Albanian (12.7%, a difference of 0.040%), Immigrants from Eritrea (12.7%, a difference of 0.16%), Immigrants from Southern Europe (12.7%, a difference of 0.19%), Costa Rican (12.8%, a difference of 0.24%), and Arapaho (12.7%, a difference of 0.25%).
| Demographics | Rating | Rank | Seniors Poverty Over the Age of 75 |
| Chileans | 13.7 /100 | #198 | Poor 12.6% |
| Immigrants | Lebanon | 12.7 /100 | #199 | Poor 12.7% |
| Immigrants | Vietnam | 12.1 /100 | #200 | Poor 12.7% |
| Paraguayans | 11.1 /100 | #201 | Poor 12.7% |
| Arapaho | 10.9 /100 | #202 | Poor 12.7% |
| Immigrants | Southern Europe | 10.7 /100 | #203 | Poor 12.7% |
| Immigrants | Eritrea | 10.5 /100 | #204 | Poor 12.7% |
| Indians (Asian) | 9.7 /100 | #205 | Tragic 12.7% |
| Albanians | 9.6 /100 | #206 | Tragic 12.7% |
| Costa Ricans | 8.7 /100 | #207 | Tragic 12.8% |
| Immigrants | Eastern Asia | 8.4 /100 | #208 | Tragic 12.8% |
| Immigrants | Liberia | 7.3 /100 | #209 | Tragic 12.8% |
| Comanche | 7.0 /100 | #210 | Tragic 12.8% |
| Brazilians | 6.9 /100 | #211 | Tragic 12.8% |
| Immigrants | Hong Kong | 6.5 /100 | #212 | Tragic 12.8% |
Demographics Similar to Finns by Seniors Poverty Over the Age of 75
In terms of seniors poverty over the age of 75, the demographic groups most similar to Finns are Latvian (10.8%, a difference of 0.14%), Scotch-Irish (10.8%, a difference of 0.30%), Luxembourger (10.8%, a difference of 0.35%), Czechoslovakian (10.9%, a difference of 0.62%), and Italian (10.8%, a difference of 0.74%).
| Demographics | Rating | Rank | Seniors Poverty Over the Age of 75 |
| Marshallese | 99.7 /100 | #31 | Exceptional 10.7% |
| British | 99.7 /100 | #32 | Exceptional 10.7% |
| Puget Sound Salish | 99.7 /100 | #33 | Exceptional 10.8% |
| Italians | 99.7 /100 | #34 | Exceptional 10.8% |
| Luxembourgers | 99.6 /100 | #35 | Exceptional 10.8% |
| Scotch-Irish | 99.6 /100 | #36 | Exceptional 10.8% |
| Latvians | 99.6 /100 | #37 | Exceptional 10.8% |
| Finns | 99.6 /100 | #38 | Exceptional 10.8% |
| Czechoslovakians | 99.4 /100 | #39 | Exceptional 10.9% |
| Thais | 99.4 /100 | #40 | Exceptional 10.9% |
| Immigrants | Lithuania | 99.2 /100 | #41 | Exceptional 11.0% |
| Austrians | 99.1 /100 | #42 | Exceptional 11.0% |
| Celtics | 99.1 /100 | #43 | Exceptional 11.0% |
| Belgians | 99.1 /100 | #44 | Exceptional 11.0% |
| Carpatho Rusyns | 99.0 /100 | #45 | Exceptional 11.1% |