Senegalese vs Immigrants from Taiwan 2 or more Vehicles in Household
COMPARE
Senegalese
Immigrants from Taiwan
2 or more Vehicles in Household
2 or more Vehicles in Household Comparison
Senegalese
Immigrants from Taiwan
44.2%
2 OR MORE VEHICLES IN HOUSEHOLD
0.0/ 100
METRIC RATING
322nd/ 347
METRIC RANK
59.7%
2 OR MORE VEHICLES IN HOUSEHOLD
100.0/ 100
METRIC RATING
45th/ 347
METRIC RANK
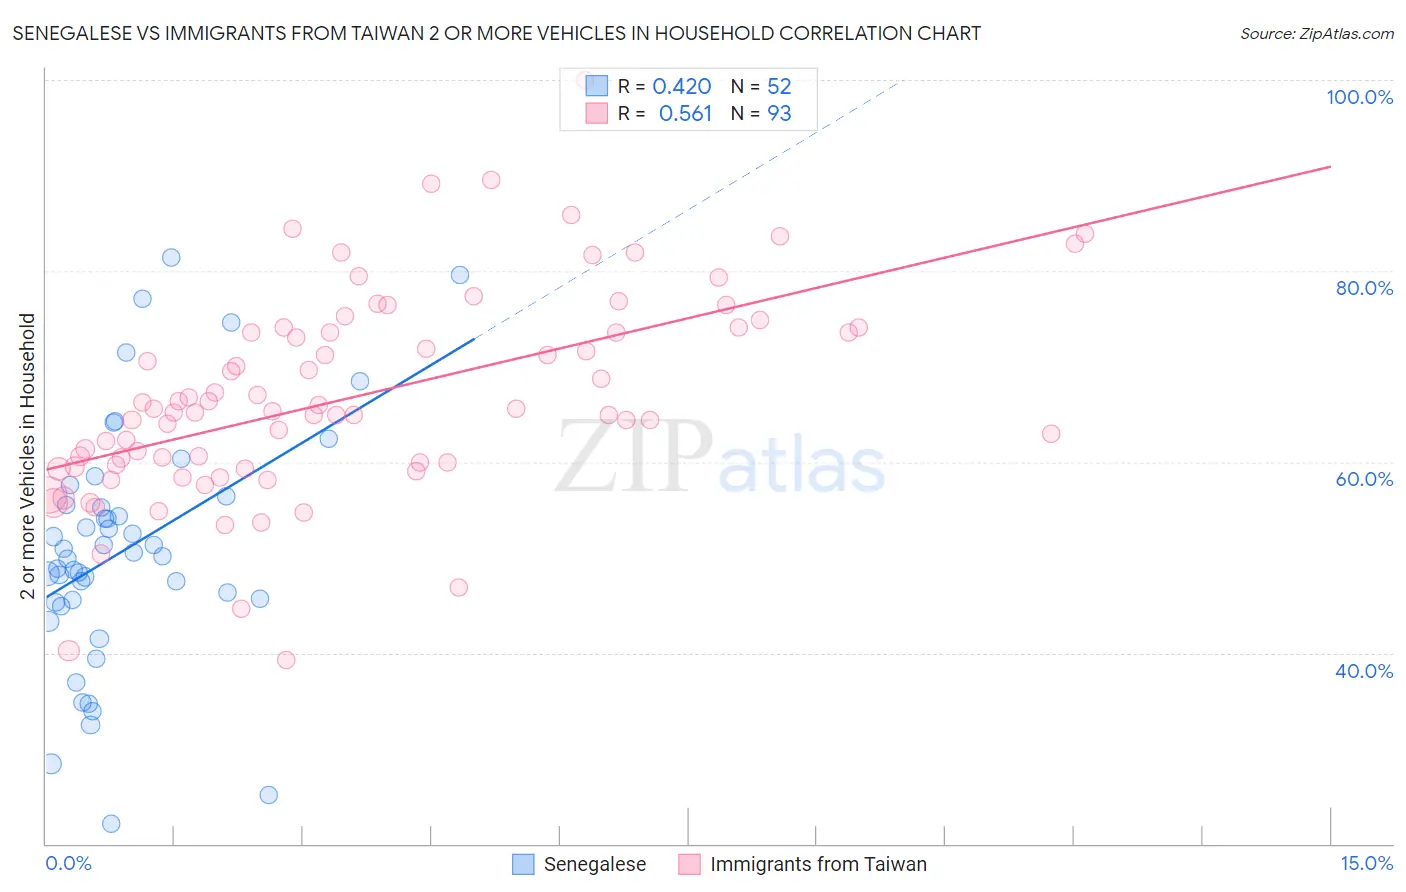
Senegalese vs Immigrants from Taiwan 2 or more Vehicles in Household Correlation Chart
The statistical analysis conducted on geographies consisting of 78,083,411 people shows a moderate positive correlation between the proportion of Senegalese and percentage of households with 2 or more vehicles available in the United States with a correlation coefficient (R) of 0.420 and weighted average of 44.2%. Similarly, the statistical analysis conducted on geographies consisting of 298,141,678 people shows a substantial positive correlation between the proportion of Immigrants from Taiwan and percentage of households with 2 or more vehicles available in the United States with a correlation coefficient (R) of 0.561 and weighted average of 59.7%, a difference of 35.1%.
2 or more Vehicles in Household Correlation Summary
| Measurement | Senegalese | Immigrants from Taiwan |
| Minimum | 22.1% | 39.2% |
| Maximum | 81.4% | 100.0% |
| Range | 59.3% | 60.8% |
| Mean | 51.0% | 66.8% |
| Median | 50.3% | 65.3% |
| Interquartile 25% (IQ1) | 45.5% | 59.6% |
| Interquartile 75% (IQ3) | 56.0% | 73.8% |
| Interquartile Range (IQR) | 10.5% | 14.2% |
| Standard Deviation (Sample) | 12.8% | 10.8% |
| Standard Deviation (Population) | 12.7% | 10.7% |
Similar Demographics by 2 or more Vehicles in Household
Demographics Similar to Senegalese by 2 or more Vehicles in Household
In terms of 2 or more vehicles in household, the demographic groups most similar to Senegalese are Immigrants from Caribbean (44.2%, a difference of 0.020%), Immigrants from Jamaica (44.5%, a difference of 0.55%), Immigrants from Cabo Verde (43.3%, a difference of 2.1%), Immigrants from West Indies (43.1%, a difference of 2.6%), and Immigrants from Senegal (43.0%, a difference of 2.8%).
| Demographics | Rating | Rank | 2 or more Vehicles in Household |
| Puerto Ricans | 0.0 /100 | #315 | Tragic 47.1% |
| Cape Verdeans | 0.0 /100 | #316 | Tragic 46.8% |
| Immigrants | Haiti | 0.0 /100 | #317 | Tragic 46.5% |
| Immigrants | Albania | 0.0 /100 | #318 | Tragic 46.0% |
| Jamaicans | 0.0 /100 | #319 | Tragic 45.8% |
| Soviet Union | 0.0 /100 | #320 | Tragic 45.7% |
| Immigrants | Jamaica | 0.0 /100 | #321 | Tragic 44.5% |
| Senegalese | 0.0 /100 | #322 | Tragic 44.2% |
| Immigrants | Caribbean | 0.0 /100 | #323 | Tragic 44.2% |
| Immigrants | Cabo Verde | 0.0 /100 | #324 | Tragic 43.3% |
| Immigrants | West Indies | 0.0 /100 | #325 | Tragic 43.1% |
| Immigrants | Senegal | 0.0 /100 | #326 | Tragic 43.0% |
| Immigrants | Yemen | 0.0 /100 | #327 | Tragic 42.8% |
| Inupiat | 0.0 /100 | #328 | Tragic 42.6% |
| Ecuadorians | 0.0 /100 | #329 | Tragic 42.0% |
Demographics Similar to Immigrants from Taiwan by 2 or more Vehicles in Household
In terms of 2 or more vehicles in household, the demographic groups most similar to Immigrants from Taiwan are French (59.8%, a difference of 0.040%), Czechoslovakian (59.8%, a difference of 0.10%), Malaysian (59.8%, a difference of 0.18%), Northern European (59.9%, a difference of 0.19%), and Cherokee (59.9%, a difference of 0.21%).
| Demographics | Rating | Rank | 2 or more Vehicles in Household |
| Americans | 100.0 /100 | #38 | Exceptional 60.0% |
| British | 100.0 /100 | #39 | Exceptional 60.0% |
| Cherokee | 100.0 /100 | #40 | Exceptional 59.9% |
| Northern Europeans | 100.0 /100 | #41 | Exceptional 59.9% |
| Malaysians | 100.0 /100 | #42 | Exceptional 59.8% |
| Czechoslovakians | 100.0 /100 | #43 | Exceptional 59.8% |
| French | 100.0 /100 | #44 | Exceptional 59.8% |
| Immigrants | Taiwan | 100.0 /100 | #45 | Exceptional 59.7% |
| Immigrants | South Eastern Asia | 100.0 /100 | #46 | Exceptional 59.6% |
| Yaqui | 99.9 /100 | #47 | Exceptional 59.3% |
| Immigrants | India | 99.9 /100 | #48 | Exceptional 59.3% |
| Belgians | 99.9 /100 | #49 | Exceptional 59.3% |
| Choctaw | 99.9 /100 | #50 | Exceptional 59.3% |
| Spaniards | 99.9 /100 | #51 | Exceptional 59.2% |
| Immigrants | Laos | 99.9 /100 | #52 | Exceptional 59.2% |