Belizean vs Immigrants from Singapore 4 or more Vehicles in Household
COMPARE
Belizean
Immigrants from Singapore
4 or more Vehicles in Household
4 or more Vehicles in Household Comparison
Belizeans
Immigrants from Singapore
6.3%
4 OR MORE VEHICLES IN HOUSEHOLD
44.5/ 100
METRIC RATING
178th/ 347
METRIC RANK
5.9%
4 OR MORE VEHICLES IN HOUSEHOLD
7.9/ 100
METRIC RATING
226th/ 347
METRIC RANK
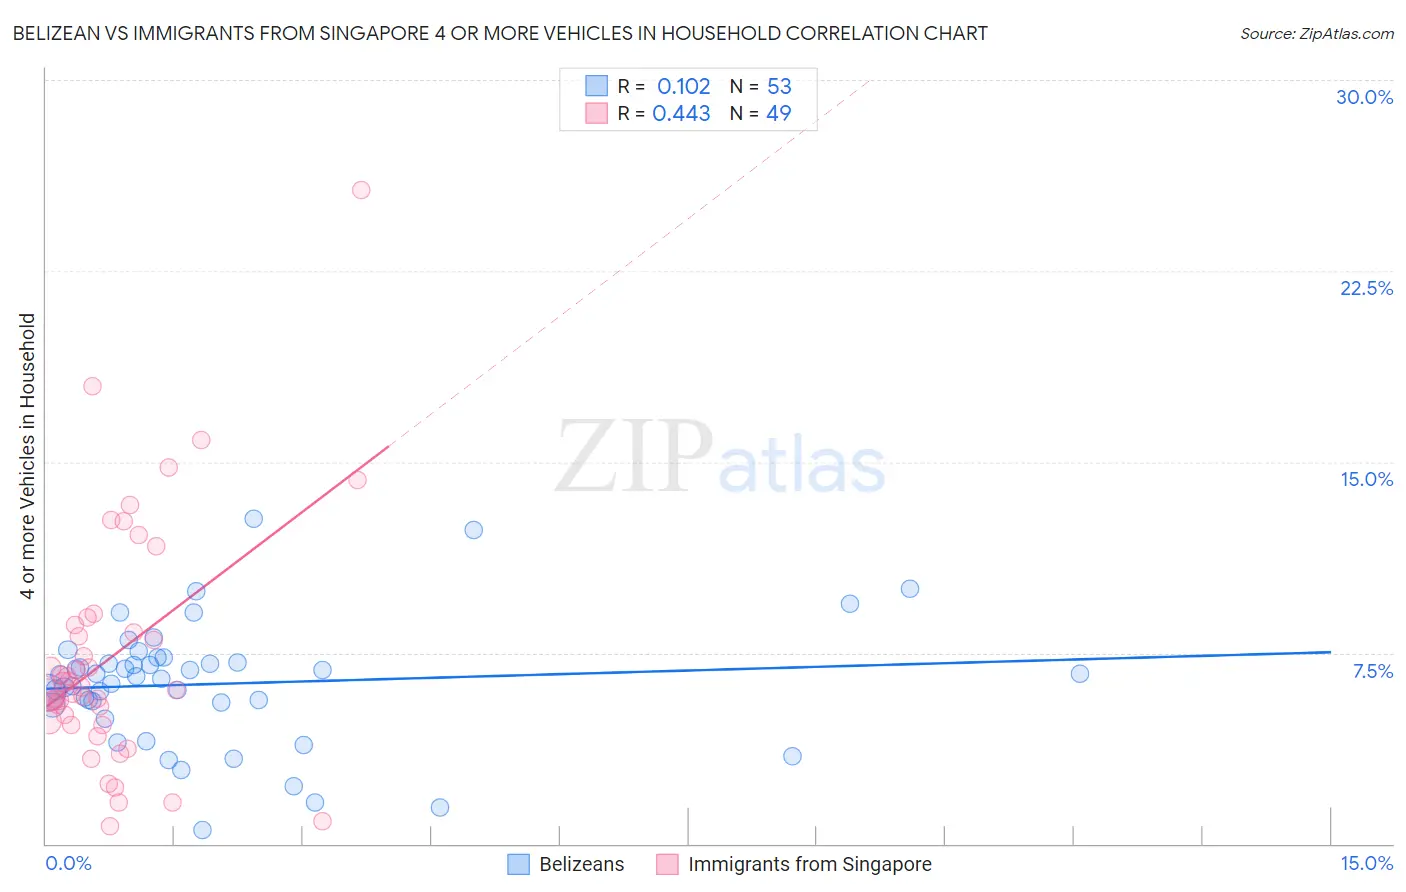
Belizean vs Immigrants from Singapore 4 or more Vehicles in Household Correlation Chart
The statistical analysis conducted on geographies consisting of 143,595,749 people shows a poor positive correlation between the proportion of Belizeans and percentage of households with 4 or more vehicles available in the United States with a correlation coefficient (R) of 0.102 and weighted average of 6.3%. Similarly, the statistical analysis conducted on geographies consisting of 136,732,831 people shows a moderate positive correlation between the proportion of Immigrants from Singapore and percentage of households with 4 or more vehicles available in the United States with a correlation coefficient (R) of 0.443 and weighted average of 5.9%, a difference of 6.0%.
4 or more Vehicles in Household Correlation Summary
| Measurement | Belizean | Immigrants from Singapore |
| Minimum | 0.54% | 0.67% |
| Maximum | 12.8% | 25.7% |
| Range | 12.2% | 25.0% |
| Mean | 6.3% | 7.4% |
| Median | 6.6% | 6.2% |
| Interquartile 25% (IQ1) | 5.5% | 4.7% |
| Interquartile 75% (IQ3) | 7.2% | 8.7% |
| Interquartile Range (IQR) | 1.7% | 4.0% |
| Standard Deviation (Sample) | 2.4% | 4.7% |
| Standard Deviation (Population) | 2.4% | 4.7% |
Similar Demographics by 4 or more Vehicles in Household
Demographics Similar to Belizeans by 4 or more Vehicles in Household
In terms of 4 or more vehicles in household, the demographic groups most similar to Belizeans are Immigrants from Japan (6.3%, a difference of 0.15%), Slovak (6.3%, a difference of 0.24%), Syrian (6.3%, a difference of 0.27%), Ukrainian (6.3%, a difference of 0.31%), and Yugoslavian (6.3%, a difference of 0.35%).
| Demographics | Rating | Rank | 4 or more Vehicles in Household |
| Immigrants | India | 51.9 /100 | #171 | Average 6.3% |
| Immigrants | Lebanon | 51.7 /100 | #172 | Average 6.3% |
| Slovenes | 51.1 /100 | #173 | Average 6.3% |
| Lithuanians | 50.0 /100 | #174 | Average 6.3% |
| Immigrants | Western Europe | 48.8 /100 | #175 | Average 6.3% |
| Ukrainians | 47.6 /100 | #176 | Average 6.3% |
| Slovaks | 46.9 /100 | #177 | Average 6.3% |
| Belizeans | 44.5 /100 | #178 | Average 6.3% |
| Immigrants | Japan | 43.1 /100 | #179 | Average 6.3% |
| Syrians | 42.0 /100 | #180 | Average 6.3% |
| Yugoslavians | 41.1 /100 | #181 | Average 6.3% |
| South American Indians | 40.7 /100 | #182 | Average 6.3% |
| Immigrants | Burma/Myanmar | 37.5 /100 | #183 | Fair 6.2% |
| Iraqis | 37.3 /100 | #184 | Fair 6.2% |
| Thais | 36.9 /100 | #185 | Fair 6.2% |
Demographics Similar to Immigrants from Singapore by 4 or more Vehicles in Household
In terms of 4 or more vehicles in household, the demographic groups most similar to Immigrants from Singapore are Immigrants from Western Asia (5.9%, a difference of 0.040%), Immigrants from Uganda (5.9%, a difference of 0.13%), Indonesian (6.0%, a difference of 0.38%), Eastern European (5.9%, a difference of 0.41%), and Cuban (6.0%, a difference of 0.46%).
| Demographics | Rating | Rank | 4 or more Vehicles in Household |
| Serbians | 11.0 /100 | #219 | Poor 6.0% |
| Russians | 10.3 /100 | #220 | Poor 6.0% |
| Immigrants | Moldova | 9.3 /100 | #221 | Tragic 6.0% |
| Cajuns | 9.2 /100 | #222 | Tragic 6.0% |
| Immigrants | Kenya | 9.2 /100 | #223 | Tragic 6.0% |
| Cubans | 9.2 /100 | #224 | Tragic 6.0% |
| Indonesians | 8.9 /100 | #225 | Tragic 6.0% |
| Immigrants | Singapore | 7.9 /100 | #226 | Tragic 5.9% |
| Immigrants | Western Asia | 7.8 /100 | #227 | Tragic 5.9% |
| Immigrants | Uganda | 7.5 /100 | #228 | Tragic 5.9% |
| Eastern Europeans | 6.8 /100 | #229 | Tragic 5.9% |
| Immigrants | Malaysia | 6.7 /100 | #230 | Tragic 5.9% |
| Immigrants | Switzerland | 6.4 /100 | #231 | Tragic 5.9% |
| Immigrants | Argentina | 6.0 /100 | #232 | Tragic 5.9% |
| Sierra Leoneans | 6.0 /100 | #233 | Tragic 5.9% |