Immigrants from Middle Africa vs Central American Indian 2 or more Vehicles in Household
COMPARE
Immigrants from Middle Africa
Central American Indian
2 or more Vehicles in Household
2 or more Vehicles in Household Comparison
Immigrants from Middle Africa
Central American Indians
53.4%
2 OR MORE VEHICLES IN HOUSEHOLD
3.0/ 100
METRIC RATING
235th/ 347
METRIC RANK
52.5%
2 OR MORE VEHICLES IN HOUSEHOLD
0.6/ 100
METRIC RATING
258th/ 347
METRIC RANK
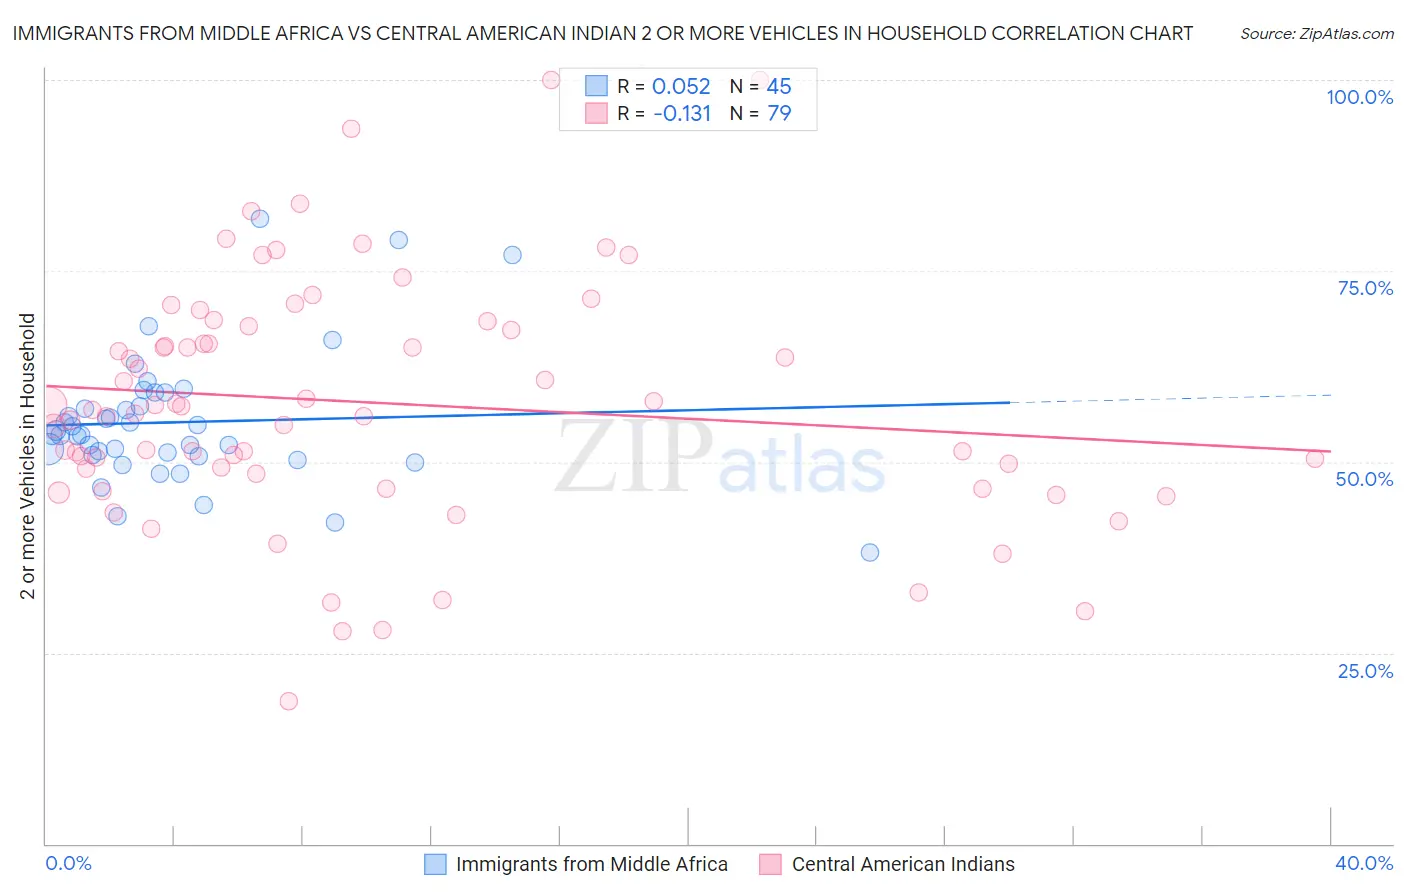
Immigrants from Middle Africa vs Central American Indian 2 or more Vehicles in Household Correlation Chart
The statistical analysis conducted on geographies consisting of 202,671,217 people shows a slight positive correlation between the proportion of Immigrants from Middle Africa and percentage of households with 2 or more vehicles available in the United States with a correlation coefficient (R) of 0.052 and weighted average of 53.4%. Similarly, the statistical analysis conducted on geographies consisting of 326,069,304 people shows a poor negative correlation between the proportion of Central American Indians and percentage of households with 2 or more vehicles available in the United States with a correlation coefficient (R) of -0.131 and weighted average of 52.5%, a difference of 1.8%.
2 or more Vehicles in Household Correlation Summary
| Measurement | Immigrants from Middle Africa | Central American Indian |
| Minimum | 38.1% | 18.7% |
| Maximum | 81.8% | 100.0% |
| Range | 43.7% | 81.3% |
| Mean | 55.2% | 57.8% |
| Median | 53.5% | 56.8% |
| Interquartile 25% (IQ1) | 50.8% | 48.5% |
| Interquartile 75% (IQ3) | 58.1% | 67.8% |
| Interquartile Range (IQR) | 7.4% | 19.3% |
| Standard Deviation (Sample) | 8.7% | 16.0% |
| Standard Deviation (Population) | 8.6% | 15.9% |
Similar Demographics by 2 or more Vehicles in Household
Demographics Similar to Immigrants from Middle Africa by 2 or more Vehicles in Household
In terms of 2 or more vehicles in household, the demographic groups most similar to Immigrants from Middle Africa are Immigrants from Switzerland (53.4%, a difference of 0.030%), Immigrants from Guatemala (53.5%, a difference of 0.090%), Ugandan (53.5%, a difference of 0.090%), Indonesian (53.4%, a difference of 0.10%), and Panamanian (53.5%, a difference of 0.16%).
| Demographics | Rating | Rank | 2 or more Vehicles in Household |
| Alaska Natives | 3.9 /100 | #228 | Tragic 53.6% |
| Immigrants | Turkey | 3.8 /100 | #229 | Tragic 53.6% |
| Immigrants | Nepal | 3.6 /100 | #230 | Tragic 53.5% |
| Panamanians | 3.4 /100 | #231 | Tragic 53.5% |
| Immigrants | Guatemala | 3.2 /100 | #232 | Tragic 53.5% |
| Ugandans | 3.2 /100 | #233 | Tragic 53.5% |
| Immigrants | Switzerland | 3.0 /100 | #234 | Tragic 53.4% |
| Immigrants | Middle Africa | 3.0 /100 | #235 | Tragic 53.4% |
| Indonesians | 2.7 /100 | #236 | Tragic 53.4% |
| Macedonians | 2.4 /100 | #237 | Tragic 53.3% |
| Immigrants | Armenia | 2.3 /100 | #238 | Tragic 53.3% |
| Cambodians | 2.3 /100 | #239 | Tragic 53.3% |
| Immigrants | Europe | 2.1 /100 | #240 | Tragic 53.2% |
| Immigrants | Sierra Leone | 2.1 /100 | #241 | Tragic 53.2% |
| Immigrants | Eastern Asia | 2.1 /100 | #242 | Tragic 53.2% |
Demographics Similar to Central American Indians by 2 or more Vehicles in Household
In terms of 2 or more vehicles in household, the demographic groups most similar to Central American Indians are Alsatian (52.5%, a difference of 0.040%), Immigrants from Hong Kong (52.6%, a difference of 0.10%), Immigrants from Bahamas (52.5%, a difference of 0.10%), Immigrants from Australia (52.4%, a difference of 0.14%), and Immigrants from Eritrea (52.6%, a difference of 0.24%).
| Demographics | Rating | Rank | 2 or more Vehicles in Household |
| Immigrants | Sudan | 1.0 /100 | #251 | Tragic 52.8% |
| Immigrants | Portugal | 1.0 /100 | #252 | Tragic 52.8% |
| Nigerians | 0.9 /100 | #253 | Tragic 52.8% |
| Immigrants | Malaysia | 0.8 /100 | #254 | Tragic 52.7% |
| Uruguayans | 0.7 /100 | #255 | Tragic 52.7% |
| Immigrants | Eritrea | 0.7 /100 | #256 | Tragic 52.6% |
| Immigrants | Hong Kong | 0.6 /100 | #257 | Tragic 52.6% |
| Central American Indians | 0.6 /100 | #258 | Tragic 52.5% |
| Alsatians | 0.6 /100 | #259 | Tragic 52.5% |
| Immigrants | Bahamas | 0.5 /100 | #260 | Tragic 52.5% |
| Immigrants | Australia | 0.5 /100 | #261 | Tragic 52.4% |
| Immigrants | Northern Africa | 0.4 /100 | #262 | Tragic 52.3% |
| Immigrants | Southern Europe | 0.4 /100 | #263 | Tragic 52.3% |
| Immigrants | Latvia | 0.4 /100 | #264 | Tragic 52.2% |
| Immigrants | Congo | 0.3 /100 | #265 | Tragic 52.1% |