Immigrants from Zaire vs Central American Indian In Labor Force | Age 25-29
COMPARE
Immigrants from Zaire
Central American Indian
In Labor Force | Age 25-29
In Labor Force | Age 25-29 Comparison
Immigrants from Zaire
Central American Indians
85.1%
IN LABOR FORCE | AGE 25-29
93.3/ 100
METRIC RATING
104th/ 347
METRIC RANK
82.4%
IN LABOR FORCE | AGE 25-29
0.0/ 100
METRIC RATING
308th/ 347
METRIC RANK
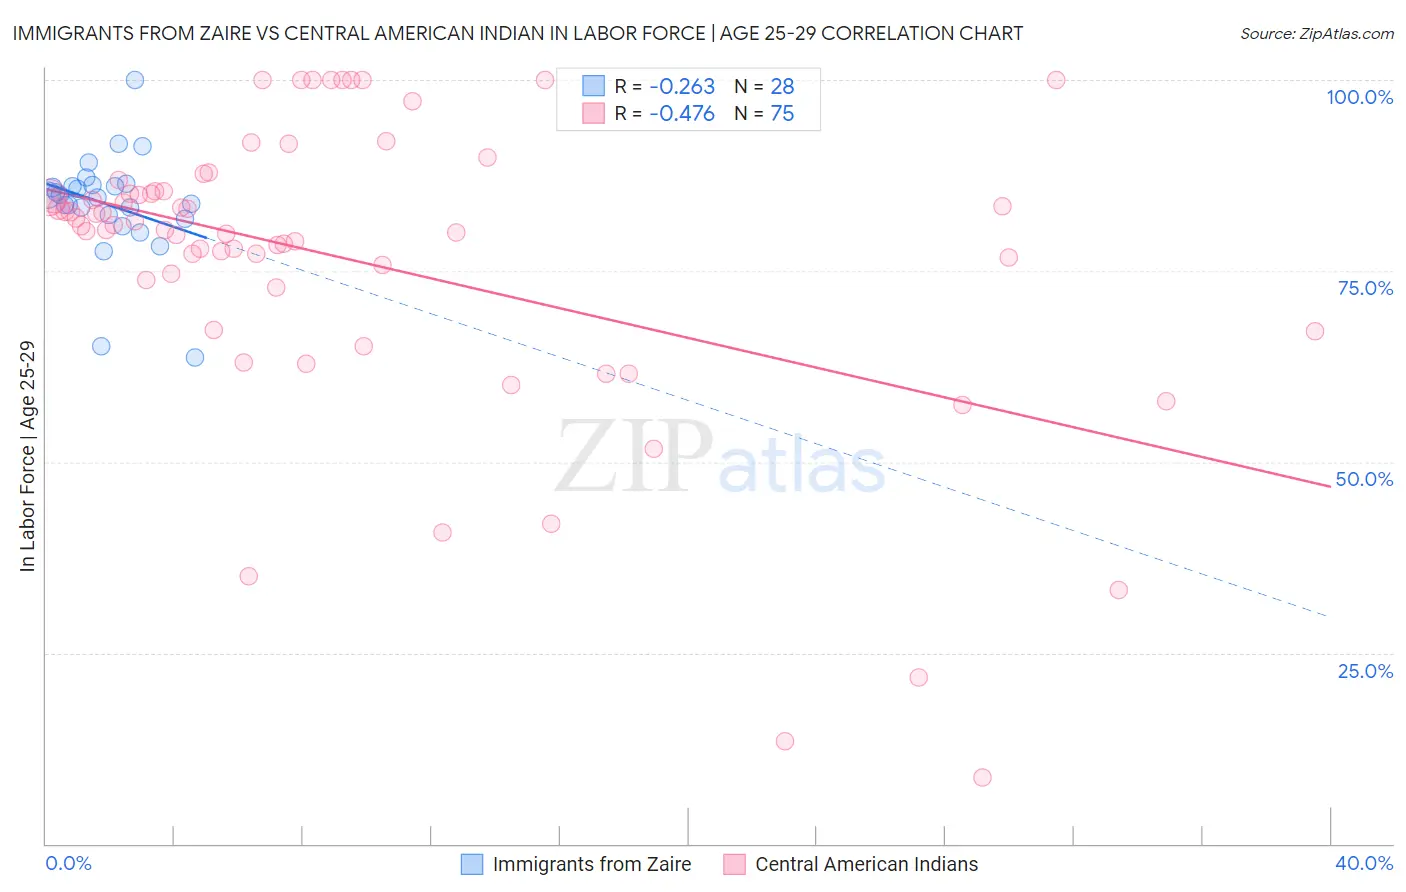
Immigrants from Zaire vs Central American Indian In Labor Force | Age 25-29 Correlation Chart
The statistical analysis conducted on geographies consisting of 107,250,343 people shows a weak negative correlation between the proportion of Immigrants from Zaire and labor force participation rate among population between the ages 25 and 29 in the United States with a correlation coefficient (R) of -0.263 and weighted average of 85.1%. Similarly, the statistical analysis conducted on geographies consisting of 326,098,631 people shows a moderate negative correlation between the proportion of Central American Indians and labor force participation rate among population between the ages 25 and 29 in the United States with a correlation coefficient (R) of -0.476 and weighted average of 82.4%, a difference of 3.2%.
In Labor Force | Age 25-29 Correlation Summary
| Measurement | Immigrants from Zaire | Central American Indian |
| Minimum | 63.6% | 8.6% |
| Maximum | 100.0% | 100.0% |
| Range | 36.4% | 91.4% |
| Mean | 83.7% | 76.3% |
| Median | 84.8% | 80.9% |
| Interquartile 25% (IQ1) | 82.1% | 72.9% |
| Interquartile 75% (IQ3) | 86.2% | 85.4% |
| Interquartile Range (IQR) | 4.1% | 12.5% |
| Standard Deviation (Sample) | 7.0% | 19.5% |
| Standard Deviation (Population) | 6.9% | 19.4% |
Similar Demographics by In Labor Force | Age 25-29
Demographics Similar to Immigrants from Zaire by In Labor Force | Age 25-29
In terms of in labor force | age 25-29, the demographic groups most similar to Immigrants from Zaire are Egyptian (85.1%, a difference of 0.010%), Slavic (85.1%, a difference of 0.010%), Immigrants from Japan (85.1%, a difference of 0.010%), Immigrants from Hong Kong (85.0%, a difference of 0.010%), and Bangladeshi (85.1%, a difference of 0.020%).
| Demographics | Rating | Rank | In Labor Force | Age 25-29 |
| Immigrants | Sudan | 94.3 /100 | #97 | Exceptional 85.1% |
| Mongolians | 94.1 /100 | #98 | Exceptional 85.1% |
| Bangladeshis | 94.0 /100 | #99 | Exceptional 85.1% |
| Immigrants | Switzerland | 93.9 /100 | #100 | Exceptional 85.1% |
| Egyptians | 93.8 /100 | #101 | Exceptional 85.1% |
| Slavs | 93.7 /100 | #102 | Exceptional 85.1% |
| Immigrants | Japan | 93.5 /100 | #103 | Exceptional 85.1% |
| Immigrants | Zaire | 93.3 /100 | #104 | Exceptional 85.1% |
| Immigrants | Hong Kong | 92.8 /100 | #105 | Exceptional 85.0% |
| Czechoslovakians | 92.6 /100 | #106 | Exceptional 85.0% |
| Immigrants | Southern Europe | 92.3 /100 | #107 | Exceptional 85.0% |
| Immigrants | Austria | 91.9 /100 | #108 | Exceptional 85.0% |
| Costa Ricans | 91.9 /100 | #109 | Exceptional 85.0% |
| New Zealanders | 91.5 /100 | #110 | Exceptional 85.0% |
| Immigrants | Middle Africa | 91.4 /100 | #111 | Exceptional 85.0% |
Demographics Similar to Central American Indians by In Labor Force | Age 25-29
In terms of in labor force | age 25-29, the demographic groups most similar to Central American Indians are Immigrants from Central America (82.4%, a difference of 0.010%), Cajun (82.5%, a difference of 0.15%), Osage (82.3%, a difference of 0.15%), Alaskan Athabascan (82.3%, a difference of 0.16%), and Black/African American (82.6%, a difference of 0.21%).
| Demographics | Rating | Rank | In Labor Force | Age 25-29 |
| Vietnamese | 0.0 /100 | #301 | Tragic 82.8% |
| Immigrants | Belize | 0.0 /100 | #302 | Tragic 82.8% |
| Immigrants | Grenada | 0.0 /100 | #303 | Tragic 82.8% |
| Immigrants | St. Vincent and the Grenadines | 0.0 /100 | #304 | Tragic 82.7% |
| Blacks/African Americans | 0.0 /100 | #305 | Tragic 82.6% |
| Blackfeet | 0.0 /100 | #306 | Tragic 82.6% |
| Cajuns | 0.0 /100 | #307 | Tragic 82.5% |
| Central American Indians | 0.0 /100 | #308 | Tragic 82.4% |
| Immigrants | Central America | 0.0 /100 | #309 | Tragic 82.4% |
| Osage | 0.0 /100 | #310 | Tragic 82.3% |
| Alaskan Athabascans | 0.0 /100 | #311 | Tragic 82.3% |
| Hispanics or Latinos | 0.0 /100 | #312 | Tragic 82.2% |
| Yaqui | 0.0 /100 | #313 | Tragic 82.2% |
| Cherokee | 0.0 /100 | #314 | Tragic 82.1% |
| Immigrants | Mexico | 0.0 /100 | #315 | Tragic 82.0% |