Immigrants from Italy vs French American Indian 3 or more Vehicles in Household
COMPARE
Immigrants from Italy
French American Indian
3 or more Vehicles in Household
3 or more Vehicles in Household Comparison
Immigrants from Italy
French American Indians
18.7%
3 OR MORE VEHICLES IN HOUSEHOLD
10.2/ 100
METRIC RATING
217th/ 347
METRIC RANK
20.1%
3 OR MORE VEHICLES IN HOUSEHOLD
85.3/ 100
METRIC RATING
140th/ 347
METRIC RANK
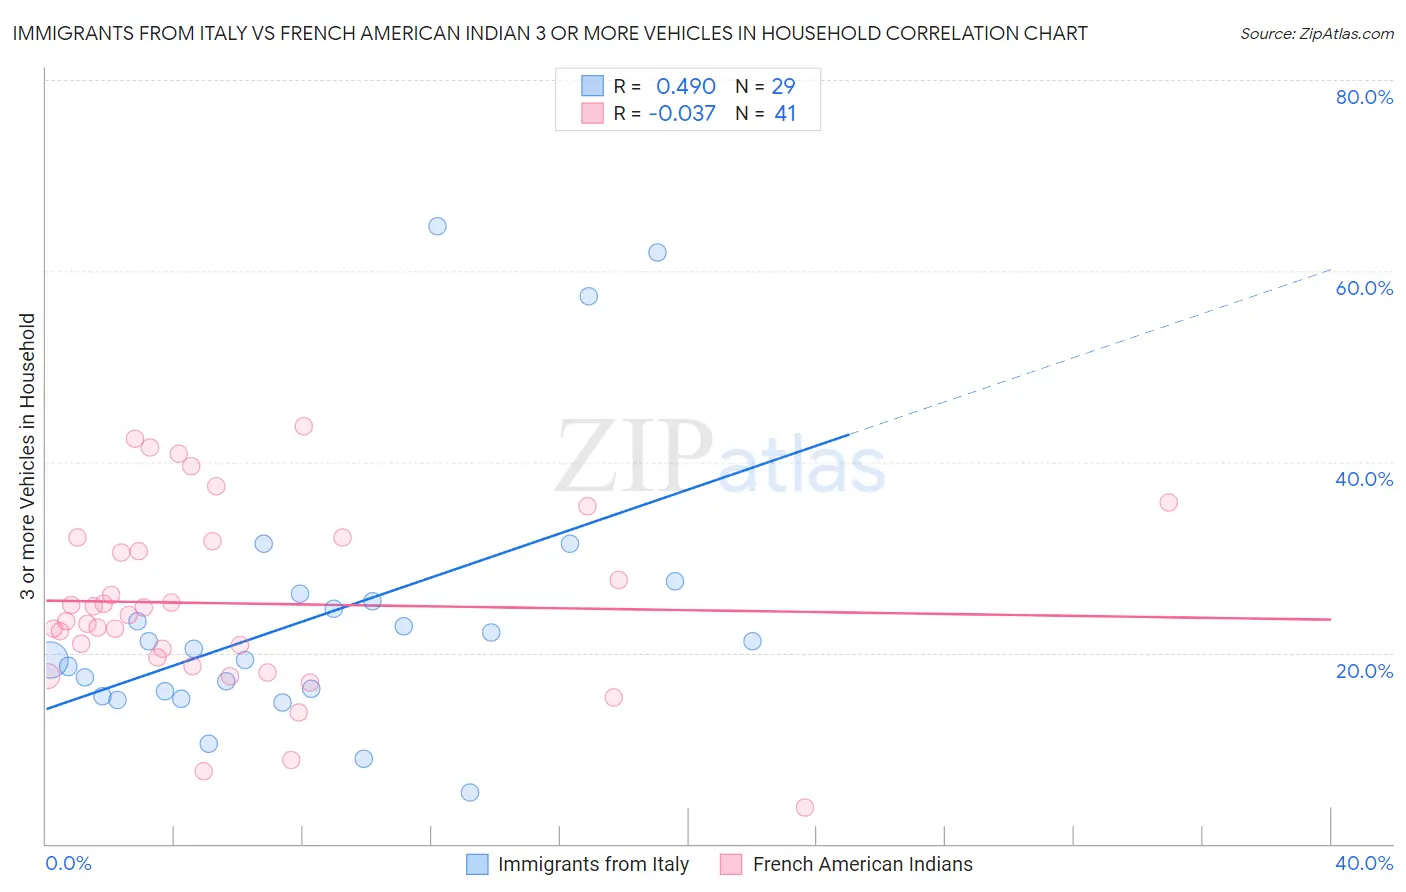
Immigrants from Italy vs French American Indian 3 or more Vehicles in Household Correlation Chart
The statistical analysis conducted on geographies consisting of 324,064,061 people shows a moderate positive correlation between the proportion of Immigrants from Italy and percentage of households with 3 or more vehicles available in the United States with a correlation coefficient (R) of 0.490 and weighted average of 18.7%. Similarly, the statistical analysis conducted on geographies consisting of 131,968,007 people shows no correlation between the proportion of French American Indians and percentage of households with 3 or more vehicles available in the United States with a correlation coefficient (R) of -0.037 and weighted average of 20.1%, a difference of 7.7%.
3 or more Vehicles in Household Correlation Summary
| Measurement | Immigrants from Italy | French American Indian |
| Minimum | 5.4% | 3.7% |
| Maximum | 64.7% | 43.8% |
| Range | 59.3% | 40.0% |
| Mean | 23.8% | 25.2% |
| Median | 20.4% | 24.0% |
| Interquartile 25% (IQ1) | 15.7% | 19.0% |
| Interquartile 75% (IQ3) | 25.7% | 31.9% |
| Interquartile Range (IQR) | 10.0% | 12.8% |
| Standard Deviation (Sample) | 14.3% | 9.5% |
| Standard Deviation (Population) | 14.1% | 9.4% |
Similar Demographics by 3 or more Vehicles in Household
Demographics Similar to Immigrants from Italy by 3 or more Vehicles in Household
In terms of 3 or more vehicles in household, the demographic groups most similar to Immigrants from Italy are Immigrants from Nigeria (18.7%, a difference of 0.020%), Eastern European (18.7%, a difference of 0.080%), Immigrants from Sierra Leone (18.7%, a difference of 0.13%), Panamanian (18.8%, a difference of 0.28%), and Immigrants from Cuba (18.8%, a difference of 0.28%).
| Demographics | Rating | Rank | 3 or more Vehicles in Household |
| Bulgarians | 13.1 /100 | #210 | Poor 18.8% |
| Immigrants | Kenya | 12.4 /100 | #211 | Poor 18.8% |
| Panamanians | 11.6 /100 | #212 | Poor 18.8% |
| Immigrants | Cuba | 11.6 /100 | #213 | Poor 18.8% |
| Immigrants | Sierra Leone | 10.8 /100 | #214 | Poor 18.7% |
| Eastern Europeans | 10.6 /100 | #215 | Poor 18.7% |
| Immigrants | Nigeria | 10.3 /100 | #216 | Poor 18.7% |
| Immigrants | Italy | 10.2 /100 | #217 | Poor 18.7% |
| Immigrants | Portugal | 8.9 /100 | #218 | Tragic 18.6% |
| Immigrants | Armenia | 8.6 /100 | #219 | Tragic 18.6% |
| Nigerians | 7.9 /100 | #220 | Tragic 18.6% |
| Immigrants | Poland | 7.5 /100 | #221 | Tragic 18.6% |
| Belizeans | 7.3 /100 | #222 | Tragic 18.6% |
| Immigrants | Czechoslovakia | 5.9 /100 | #223 | Tragic 18.5% |
| Immigrants | Argentina | 5.6 /100 | #224 | Tragic 18.5% |
Demographics Similar to French American Indians by 3 or more Vehicles in Household
In terms of 3 or more vehicles in household, the demographic groups most similar to French American Indians are Slovene (20.2%, a difference of 0.030%), Ottawa (20.1%, a difference of 0.060%), Jordanian (20.1%, a difference of 0.12%), Lithuanian (20.1%, a difference of 0.13%), and Aleut (20.2%, a difference of 0.15%).
| Demographics | Rating | Rank | 3 or more Vehicles in Household |
| Immigrants | North America | 87.8 /100 | #133 | Excellent 20.2% |
| Poles | 87.3 /100 | #134 | Excellent 20.2% |
| Immigrants | India | 87.2 /100 | #135 | Excellent 20.2% |
| Immigrants | Nicaragua | 87.1 /100 | #136 | Excellent 20.2% |
| Immigrants | Iraq | 87.1 /100 | #137 | Excellent 20.2% |
| Aleuts | 86.3 /100 | #138 | Excellent 20.2% |
| Slovenes | 85.5 /100 | #139 | Excellent 20.2% |
| French American Indians | 85.3 /100 | #140 | Excellent 20.1% |
| Ottawa | 84.9 /100 | #141 | Excellent 20.1% |
| Jordanians | 84.4 /100 | #142 | Excellent 20.1% |
| Lithuanians | 84.4 /100 | #143 | Excellent 20.1% |
| Iranians | 84.0 /100 | #144 | Excellent 20.1% |
| Palestinians | 83.9 /100 | #145 | Excellent 20.1% |
| Australians | 83.6 /100 | #146 | Excellent 20.1% |
| Slovaks | 83.0 /100 | #147 | Excellent 20.1% |