Immigrants from Uruguay vs Belgian Self-Care Disability
COMPARE
Immigrants from Uruguay
Belgian
Self-Care Disability
Self-Care Disability Comparison
Immigrants from Uruguay
Belgians
2.4%
SELF-CARE DISABILITY
85.4/ 100
METRIC RATING
140th/ 347
METRIC RANK
2.4%
SELF-CARE DISABILITY
90.9/ 100
METRIC RATING
122nd/ 347
METRIC RANK
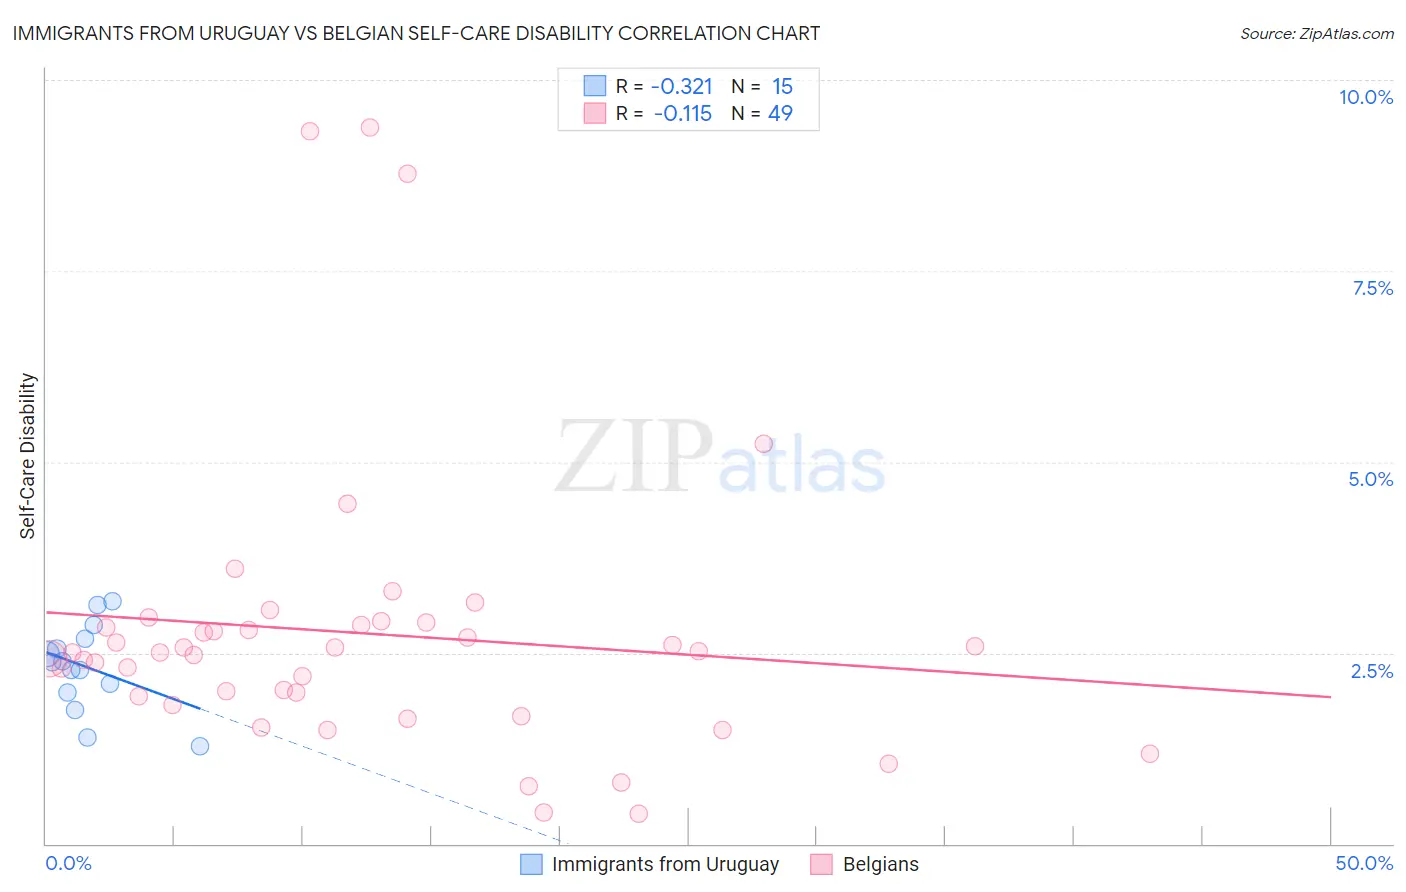
Immigrants from Uruguay vs Belgian Self-Care Disability Correlation Chart
The statistical analysis conducted on geographies consisting of 133,239,464 people shows a mild negative correlation between the proportion of Immigrants from Uruguay and percentage of population with self-care disability in the United States with a correlation coefficient (R) of -0.321 and weighted average of 2.4%. Similarly, the statistical analysis conducted on geographies consisting of 355,581,666 people shows a poor negative correlation between the proportion of Belgians and percentage of population with self-care disability in the United States with a correlation coefficient (R) of -0.115 and weighted average of 2.4%, a difference of 0.65%.
Self-Care Disability Correlation Summary
| Measurement | Immigrants from Uruguay | Belgian |
| Minimum | 1.3% | 0.39% |
| Maximum | 3.2% | 9.4% |
| Range | 1.9% | 9.0% |
| Mean | 2.3% | 2.8% |
| Median | 2.4% | 2.5% |
| Interquartile 25% (IQ1) | 2.0% | 1.9% |
| Interquartile 75% (IQ3) | 2.7% | 2.9% |
| Interquartile Range (IQR) | 0.69% | 1.0% |
| Standard Deviation (Sample) | 0.56% | 1.9% |
| Standard Deviation (Population) | 0.54% | 1.9% |
Demographics Similar to Immigrants from Uruguay and Belgians by Self-Care Disability
In terms of self-care disability, the demographic groups most similar to Immigrants from Uruguay are Alaska Native (2.4%, a difference of 0.090%), Immigrants from Croatia (2.4%, a difference of 0.12%), Sri Lankan (2.4%, a difference of 0.12%), Austrian (2.4%, a difference of 0.17%), and South American Indian (2.4%, a difference of 0.19%). Similarly, the demographic groups most similar to Belgians are Peruvian (2.4%, a difference of 0.070%), Immigrants from Nigeria (2.4%, a difference of 0.080%), Immigrants from Morocco (2.4%, a difference of 0.090%), Immigrants from North America (2.4%, a difference of 0.090%), and Hmong (2.4%, a difference of 0.13%).
| Demographics | Rating | Rank | Self-Care Disability |
| Peruvians | 91.3 /100 | #121 | Exceptional 2.4% |
| Belgians | 90.9 /100 | #122 | Exceptional 2.4% |
| Immigrants | Nigeria | 90.3 /100 | #123 | Exceptional 2.4% |
| Immigrants | Morocco | 90.2 /100 | #124 | Exceptional 2.4% |
| Immigrants | North America | 90.2 /100 | #124 | Exceptional 2.4% |
| Hmong | 89.9 /100 | #126 | Excellent 2.4% |
| Colombians | 89.7 /100 | #127 | Excellent 2.4% |
| Immigrants | Hungary | 89.6 /100 | #128 | Excellent 2.4% |
| Immigrants | Romania | 89.3 /100 | #129 | Excellent 2.4% |
| Immigrants | Austria | 89.0 /100 | #130 | Excellent 2.4% |
| Poles | 88.9 /100 | #131 | Excellent 2.4% |
| Immigrants | South America | 88.8 /100 | #132 | Excellent 2.4% |
| Immigrants | Colombia | 88.5 /100 | #133 | Excellent 2.4% |
| Russians | 88.2 /100 | #134 | Excellent 2.4% |
| Laotians | 87.8 /100 | #135 | Excellent 2.4% |
| South American Indians | 87.2 /100 | #136 | Excellent 2.4% |
| Austrians | 87.0 /100 | #137 | Excellent 2.4% |
| Immigrants | Croatia | 86.6 /100 | #138 | Excellent 2.4% |
| Sri Lankans | 86.6 /100 | #139 | Excellent 2.4% |
| Immigrants | Uruguay | 85.4 /100 | #140 | Excellent 2.4% |
| Alaska Natives | 84.5 /100 | #141 | Excellent 2.4% |