Immigrants from West Indies vs Belgian 4 or more Vehicles in Household
COMPARE
Immigrants from West Indies
Belgian
4 or more Vehicles in Household
4 or more Vehicles in Household Comparison
Immigrants from West Indies
Belgians
4.7%
4 OR MORE VEHICLES IN HOUSEHOLD
0.0/ 100
METRIC RATING
314th/ 347
METRIC RANK
6.8%
4 OR MORE VEHICLES IN HOUSEHOLD
94.1/ 100
METRIC RATING
126th/ 347
METRIC RANK
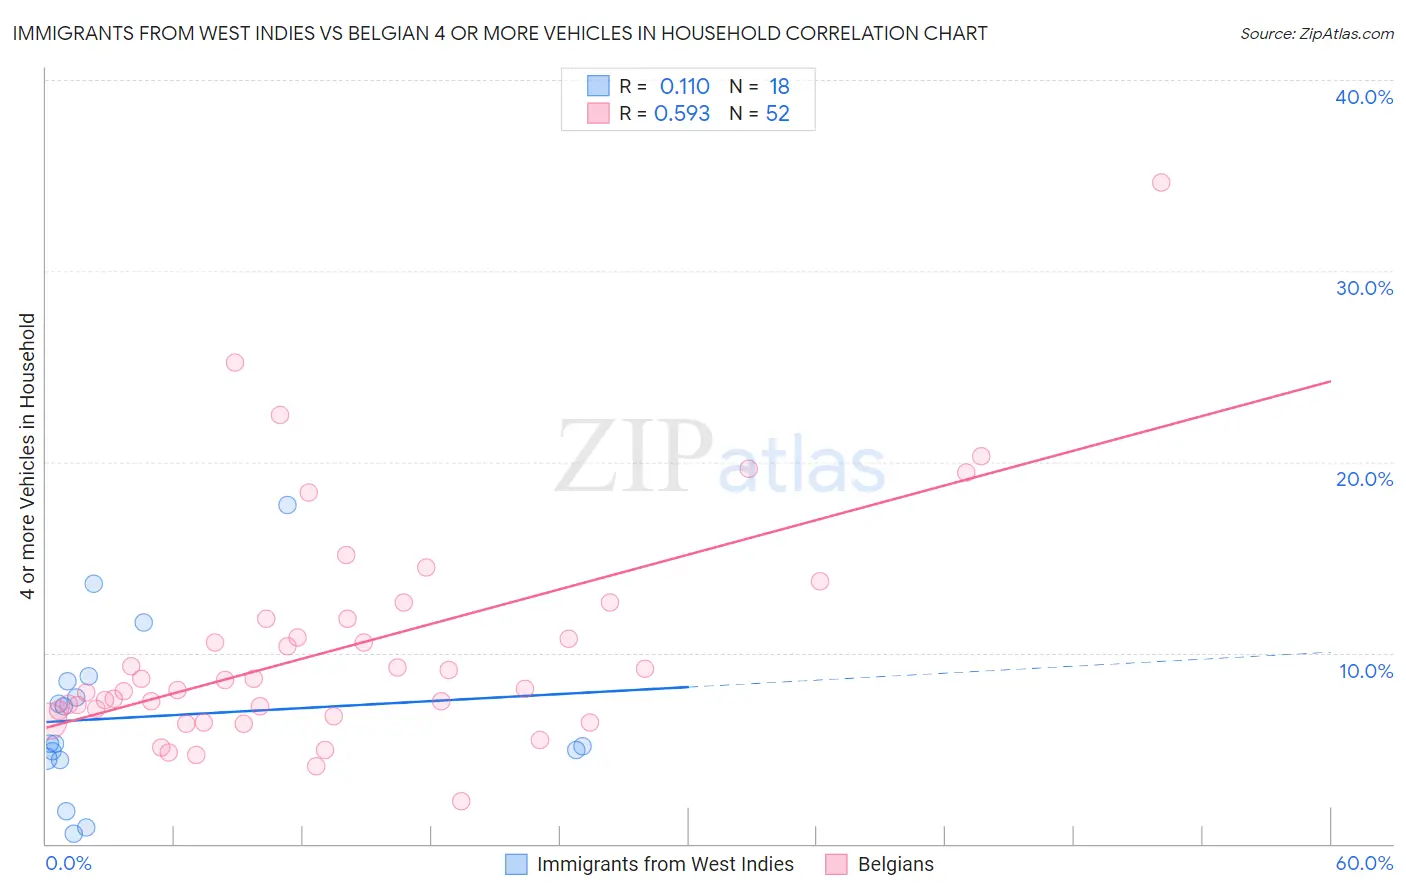
Immigrants from West Indies vs Belgian 4 or more Vehicles in Household Correlation Chart
The statistical analysis conducted on geographies consisting of 72,052,209 people shows a poor positive correlation between the proportion of Immigrants from West Indies and percentage of households with 4 or more vehicles available in the United States with a correlation coefficient (R) of 0.110 and weighted average of 4.7%. Similarly, the statistical analysis conducted on geographies consisting of 354,799,341 people shows a substantial positive correlation between the proportion of Belgians and percentage of households with 4 or more vehicles available in the United States with a correlation coefficient (R) of 0.593 and weighted average of 6.8%, a difference of 42.6%.
4 or more Vehicles in Household Correlation Summary
| Measurement | Immigrants from West Indies | Belgian |
| Minimum | 0.50% | 2.2% |
| Maximum | 17.7% | 34.6% |
| Range | 17.2% | 32.4% |
| Mean | 6.6% | 10.3% |
| Median | 5.3% | 8.3% |
| Interquartile 25% (IQ1) | 4.5% | 6.8% |
| Interquartile 75% (IQ3) | 8.5% | 11.8% |
| Interquartile Range (IQR) | 4.0% | 4.9% |
| Standard Deviation (Sample) | 4.4% | 6.0% |
| Standard Deviation (Population) | 4.2% | 5.9% |
Similar Demographics by 4 or more Vehicles in Household
Demographics Similar to Immigrants from West Indies by 4 or more Vehicles in Household
In terms of 4 or more vehicles in household, the demographic groups most similar to Immigrants from West Indies are Immigrants from Belarus (4.7%, a difference of 0.090%), Puerto Rican (4.7%, a difference of 0.53%), Immigrants from Israel (4.8%, a difference of 0.79%), Albanian (4.8%, a difference of 0.81%), and U.S. Virgin Islander (4.6%, a difference of 2.2%).
| Demographics | Rating | Rank | 4 or more Vehicles in Household |
| Menominee | 0.0 /100 | #307 | Tragic 5.0% |
| Paraguayans | 0.0 /100 | #308 | Tragic 4.9% |
| Immigrants | Somalia | 0.0 /100 | #309 | Tragic 4.9% |
| Moroccans | 0.0 /100 | #310 | Tragic 4.9% |
| Houma | 0.0 /100 | #311 | Tragic 4.9% |
| Albanians | 0.0 /100 | #312 | Tragic 4.8% |
| Immigrants | Israel | 0.0 /100 | #313 | Tragic 4.8% |
| Immigrants | West Indies | 0.0 /100 | #314 | Tragic 4.7% |
| Immigrants | Belarus | 0.0 /100 | #315 | Tragic 4.7% |
| Puerto Ricans | 0.0 /100 | #316 | Tragic 4.7% |
| U.S. Virgin Islanders | 0.0 /100 | #317 | Tragic 4.6% |
| Jamaicans | 0.0 /100 | #318 | Tragic 4.6% |
| Haitians | 0.0 /100 | #319 | Tragic 4.6% |
| Immigrants | Haiti | 0.0 /100 | #320 | Tragic 4.5% |
| Ecuadorians | 0.0 /100 | #321 | Tragic 4.5% |
Demographics Similar to Belgians by 4 or more Vehicles in Household
In terms of 4 or more vehicles in household, the demographic groups most similar to Belgians are Austrian (6.8%, a difference of 0.010%), Immigrants from Asia (6.8%, a difference of 0.10%), Immigrants from Korea (6.8%, a difference of 0.12%), Immigrants (6.8%, a difference of 0.20%), and Immigrants from Germany (6.8%, a difference of 0.27%).
| Demographics | Rating | Rank | 4 or more Vehicles in Household |
| Costa Ricans | 95.5 /100 | #119 | Exceptional 6.8% |
| Comanche | 94.8 /100 | #120 | Exceptional 6.8% |
| Immigrants | Germany | 94.7 /100 | #121 | Exceptional 6.8% |
| Immigrants | Nicaragua | 94.7 /100 | #122 | Exceptional 6.8% |
| Immigrants | Immigrants | 94.6 /100 | #123 | Exceptional 6.8% |
| Immigrants | Asia | 94.4 /100 | #124 | Exceptional 6.8% |
| Austrians | 94.1 /100 | #125 | Exceptional 6.8% |
| Belgians | 94.1 /100 | #126 | Exceptional 6.8% |
| Immigrants | Korea | 93.8 /100 | #127 | Exceptional 6.8% |
| Immigrants | Bolivia | 92.5 /100 | #128 | Exceptional 6.7% |
| Immigrants | England | 92.0 /100 | #129 | Exceptional 6.7% |
| Immigrants | Scotland | 89.0 /100 | #130 | Excellent 6.7% |
| Maltese | 88.4 /100 | #131 | Excellent 6.7% |
| Immigrants | Netherlands | 87.8 /100 | #132 | Excellent 6.6% |
| Armenians | 86.9 /100 | #133 | Excellent 6.6% |