Liberian vs Belgian 4 or more Vehicles in Household
COMPARE
Liberian
Belgian
4 or more Vehicles in Household
4 or more Vehicles in Household Comparison
Liberians
Belgians
5.3%
4 OR MORE VEHICLES IN HOUSEHOLD
0.1/ 100
METRIC RATING
292nd/ 347
METRIC RANK
6.8%
4 OR MORE VEHICLES IN HOUSEHOLD
94.1/ 100
METRIC RATING
126th/ 347
METRIC RANK
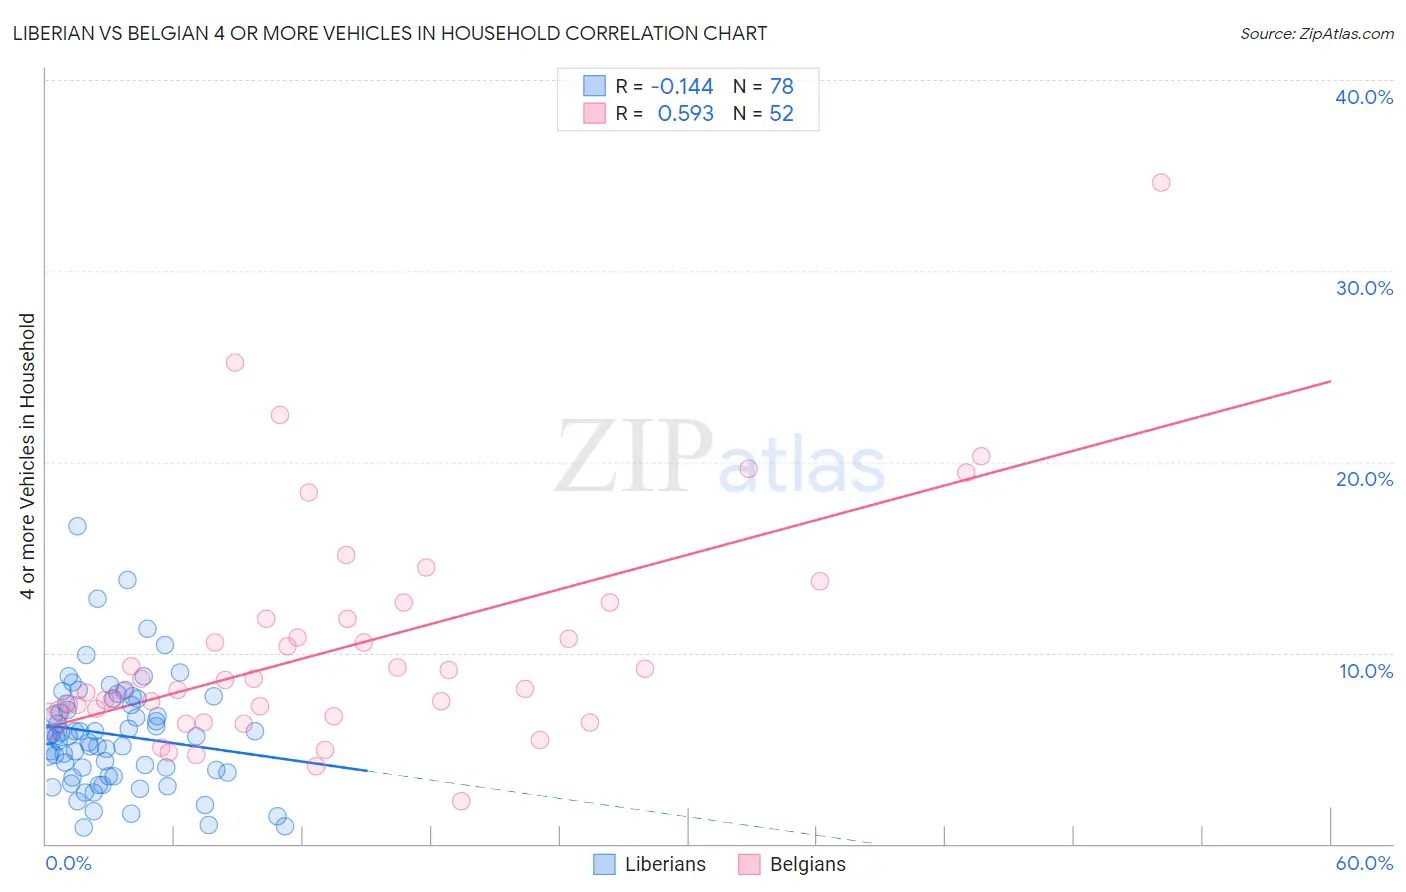
Liberian vs Belgian 4 or more Vehicles in Household Correlation Chart
The statistical analysis conducted on geographies consisting of 117,822,398 people shows a poor negative correlation between the proportion of Liberians and percentage of households with 4 or more vehicles available in the United States with a correlation coefficient (R) of -0.144 and weighted average of 5.3%. Similarly, the statistical analysis conducted on geographies consisting of 354,799,341 people shows a substantial positive correlation between the proportion of Belgians and percentage of households with 4 or more vehicles available in the United States with a correlation coefficient (R) of 0.593 and weighted average of 6.8%, a difference of 28.9%.
4 or more Vehicles in Household Correlation Summary
| Measurement | Liberian | Belgian |
| Minimum | 0.87% | 2.2% |
| Maximum | 16.6% | 34.6% |
| Range | 15.8% | 32.4% |
| Mean | 5.7% | 10.3% |
| Median | 5.6% | 8.3% |
| Interquartile 25% (IQ1) | 3.7% | 6.8% |
| Interquartile 75% (IQ3) | 7.3% | 11.8% |
| Interquartile Range (IQR) | 3.6% | 4.9% |
| Standard Deviation (Sample) | 2.9% | 6.0% |
| Standard Deviation (Population) | 2.9% | 5.9% |
Similar Demographics by 4 or more Vehicles in Household
Demographics Similar to Liberians by 4 or more Vehicles in Household
In terms of 4 or more vehicles in household, the demographic groups most similar to Liberians are Immigrants from Congo (5.2%, a difference of 0.030%), Ghanaian (5.2%, a difference of 0.090%), Immigrants from Bahamas (5.3%, a difference of 0.10%), Immigrants from Brazil (5.2%, a difference of 0.20%), and Israeli (5.2%, a difference of 0.38%).
| Demographics | Rating | Rank | 4 or more Vehicles in Household |
| Immigrants | Liberia | 0.2 /100 | #285 | Tragic 5.4% |
| Immigrants | Colombia | 0.2 /100 | #286 | Tragic 5.4% |
| Immigrants | Croatia | 0.2 /100 | #287 | Tragic 5.4% |
| Venezuelans | 0.2 /100 | #288 | Tragic 5.3% |
| Immigrants | Bosnia and Herzegovina | 0.2 /100 | #289 | Tragic 5.3% |
| Immigrants | Russia | 0.2 /100 | #290 | Tragic 5.3% |
| Immigrants | Bahamas | 0.1 /100 | #291 | Tragic 5.3% |
| Liberians | 0.1 /100 | #292 | Tragic 5.3% |
| Immigrants | Congo | 0.1 /100 | #293 | Tragic 5.2% |
| Ghanaians | 0.1 /100 | #294 | Tragic 5.2% |
| Immigrants | Brazil | 0.1 /100 | #295 | Tragic 5.2% |
| Israelis | 0.1 /100 | #296 | Tragic 5.2% |
| Immigrants | Venezuela | 0.1 /100 | #297 | Tragic 5.2% |
| Immigrants | South America | 0.1 /100 | #298 | Tragic 5.2% |
| Immigrants | Ghana | 0.1 /100 | #299 | Tragic 5.2% |
Demographics Similar to Belgians by 4 or more Vehicles in Household
In terms of 4 or more vehicles in household, the demographic groups most similar to Belgians are Austrian (6.8%, a difference of 0.010%), Immigrants from Asia (6.8%, a difference of 0.10%), Immigrants from Korea (6.8%, a difference of 0.12%), Immigrants (6.8%, a difference of 0.20%), and Immigrants from Germany (6.8%, a difference of 0.27%).
| Demographics | Rating | Rank | 4 or more Vehicles in Household |
| Costa Ricans | 95.5 /100 | #119 | Exceptional 6.8% |
| Comanche | 94.8 /100 | #120 | Exceptional 6.8% |
| Immigrants | Germany | 94.7 /100 | #121 | Exceptional 6.8% |
| Immigrants | Nicaragua | 94.7 /100 | #122 | Exceptional 6.8% |
| Immigrants | Immigrants | 94.6 /100 | #123 | Exceptional 6.8% |
| Immigrants | Asia | 94.4 /100 | #124 | Exceptional 6.8% |
| Austrians | 94.1 /100 | #125 | Exceptional 6.8% |
| Belgians | 94.1 /100 | #126 | Exceptional 6.8% |
| Immigrants | Korea | 93.8 /100 | #127 | Exceptional 6.8% |
| Immigrants | Bolivia | 92.5 /100 | #128 | Exceptional 6.7% |
| Immigrants | England | 92.0 /100 | #129 | Exceptional 6.7% |
| Immigrants | Scotland | 89.0 /100 | #130 | Excellent 6.7% |
| Maltese | 88.4 /100 | #131 | Excellent 6.7% |
| Immigrants | Netherlands | 87.8 /100 | #132 | Excellent 6.6% |
| Armenians | 86.9 /100 | #133 | Excellent 6.6% |