Immigrants from Russia vs Czechoslovakian 1 or more Vehicles in Household
COMPARE
Immigrants from Russia
Czechoslovakian
1 or more Vehicles in Household
1 or more Vehicles in Household Comparison
Immigrants from Russia
Czechoslovakians
85.4%
1 OR MORE VEHICLES IN HOUSEHOLD
0.0/ 100
METRIC RATING
300th/ 347
METRIC RANK
92.3%
1 OR MORE VEHICLES IN HOUSEHOLD
99.9/ 100
METRIC RATING
35th/ 347
METRIC RANK
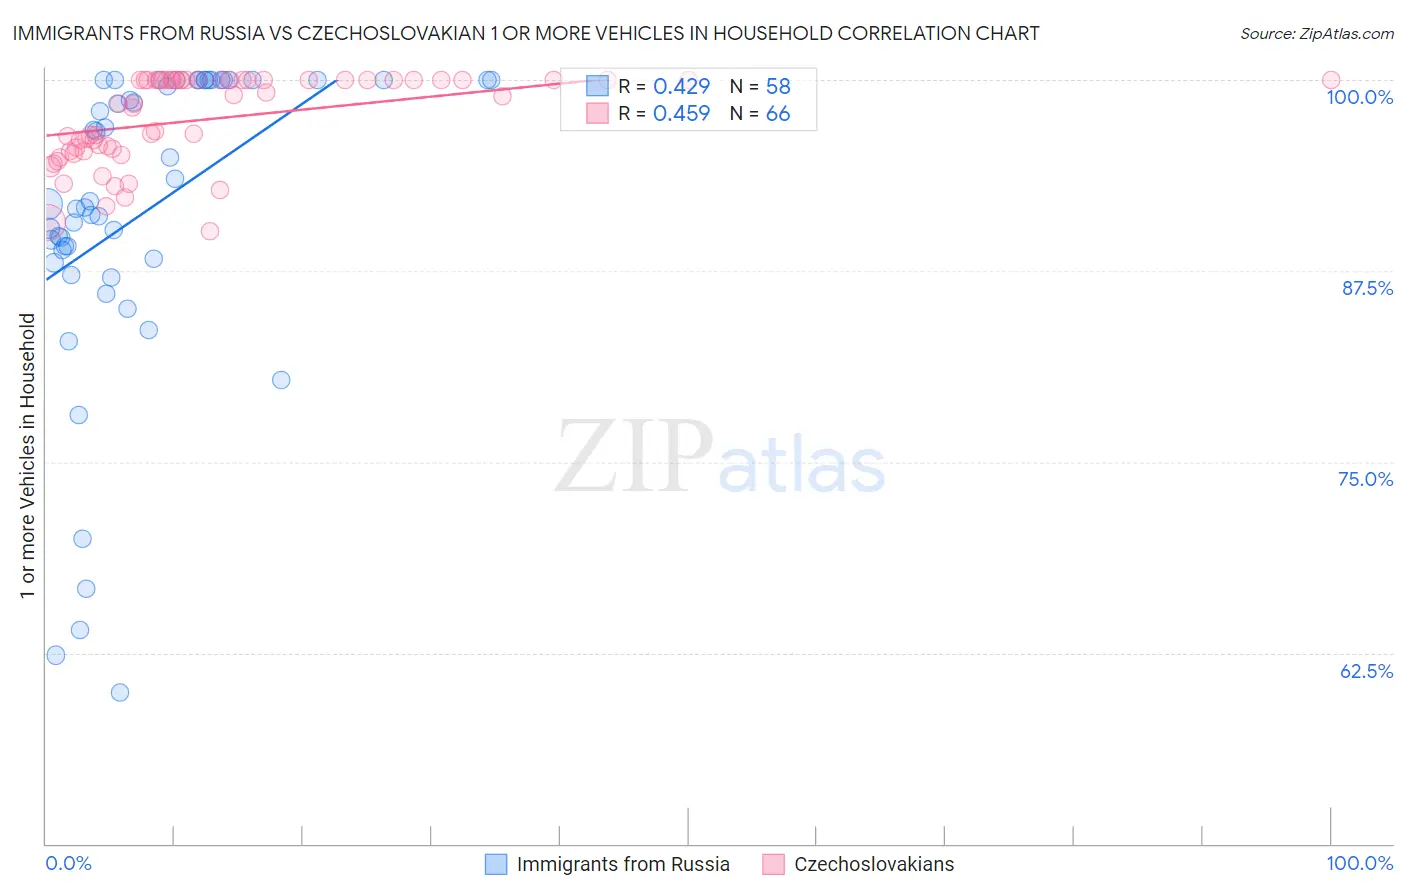
Immigrants from Russia vs Czechoslovakian 1 or more Vehicles in Household Correlation Chart
The statistical analysis conducted on geographies consisting of 347,625,185 people shows a moderate positive correlation between the proportion of Immigrants from Russia and percentage of households with 1 or more vehicles available in the United States with a correlation coefficient (R) of 0.429 and weighted average of 85.4%. Similarly, the statistical analysis conducted on geographies consisting of 368,548,563 people shows a moderate positive correlation between the proportion of Czechoslovakians and percentage of households with 1 or more vehicles available in the United States with a correlation coefficient (R) of 0.459 and weighted average of 92.3%, a difference of 8.0%.
1 or more Vehicles in Household Correlation Summary
| Measurement | Immigrants from Russia | Czechoslovakian |
| Minimum | 59.9% | 90.1% |
| Maximum | 100.0% | 100.0% |
| Range | 40.1% | 9.9% |
| Mean | 91.3% | 97.5% |
| Median | 92.0% | 98.7% |
| Interquartile 25% (IQ1) | 88.3% | 95.4% |
| Interquartile 75% (IQ3) | 100.0% | 100.0% |
| Interquartile Range (IQR) | 11.7% | 4.6% |
| Standard Deviation (Sample) | 10.2% | 2.9% |
| Standard Deviation (Population) | 10.1% | 2.8% |
Similar Demographics by 1 or more Vehicles in Household
Demographics Similar to Immigrants from Russia by 1 or more Vehicles in Household
In terms of 1 or more vehicles in household, the demographic groups most similar to Immigrants from Russia are Yuman (85.5%, a difference of 0.0%), Immigrants from Panama (85.4%, a difference of 0.040%), Moroccan (85.4%, a difference of 0.060%), Immigrants from Greece (85.4%, a difference of 0.090%), and Belizean (85.7%, a difference of 0.25%).
| Demographics | Rating | Rank | 1 or more Vehicles in Household |
| Indians (Asian) | 0.0 /100 | #293 | Tragic 86.0% |
| Alaskan Athabascans | 0.0 /100 | #294 | Tragic 86.0% |
| Immigrants | Jamaica | 0.0 /100 | #295 | Tragic 85.8% |
| Immigrants | Spain | 0.0 /100 | #296 | Tragic 85.8% |
| Paraguayans | 0.0 /100 | #297 | Tragic 85.7% |
| Belizeans | 0.0 /100 | #298 | Tragic 85.7% |
| Yuman | 0.0 /100 | #299 | Tragic 85.5% |
| Immigrants | Russia | 0.0 /100 | #300 | Tragic 85.4% |
| Immigrants | Panama | 0.0 /100 | #301 | Tragic 85.4% |
| Moroccans | 0.0 /100 | #302 | Tragic 85.4% |
| Immigrants | Greece | 0.0 /100 | #303 | Tragic 85.4% |
| Immigrants | Ukraine | 0.0 /100 | #304 | Tragic 85.2% |
| Immigrants | China | 0.0 /100 | #305 | Tragic 84.9% |
| Immigrants | Western Africa | 0.0 /100 | #306 | Tragic 84.9% |
| Tohono O'odham | 0.0 /100 | #307 | Tragic 84.7% |
Demographics Similar to Czechoslovakians by 1 or more Vehicles in Household
In terms of 1 or more vehicles in household, the demographic groups most similar to Czechoslovakians are Malaysian (92.3%, a difference of 0.0%), Italian (92.3%, a difference of 0.010%), French Canadian (92.3%, a difference of 0.010%), Immigrants from Vietnam (92.3%, a difference of 0.020%), and Swiss (92.3%, a difference of 0.020%).
| Demographics | Rating | Rank | 1 or more Vehicles in Household |
| Sri Lankans | 100.0 /100 | #28 | Exceptional 92.5% |
| Native Hawaiians | 100.0 /100 | #29 | Exceptional 92.4% |
| Finns | 100.0 /100 | #30 | Exceptional 92.4% |
| Samoans | 100.0 /100 | #31 | Exceptional 92.4% |
| Basques | 100.0 /100 | #32 | Exceptional 92.4% |
| Cherokee | 100.0 /100 | #33 | Exceptional 92.4% |
| Italians | 99.9 /100 | #34 | Exceptional 92.3% |
| Czechoslovakians | 99.9 /100 | #35 | Exceptional 92.3% |
| Malaysians | 99.9 /100 | #36 | Exceptional 92.3% |
| French Canadians | 99.9 /100 | #37 | Exceptional 92.3% |
| Immigrants | Vietnam | 99.9 /100 | #38 | Exceptional 92.3% |
| Swiss | 99.9 /100 | #39 | Exceptional 92.3% |
| Creek | 99.9 /100 | #40 | Exceptional 92.3% |
| Immigrants | Taiwan | 99.9 /100 | #41 | Exceptional 92.3% |
| Chickasaw | 99.9 /100 | #42 | Exceptional 92.3% |