Vietnamese vs Czechoslovakian 1 or more Vehicles in Household
COMPARE
Vietnamese
Czechoslovakian
1 or more Vehicles in Household
1 or more Vehicles in Household Comparison
Vietnamese
Czechoslovakians
73.8%
1 OR MORE VEHICLES IN HOUSEHOLD
0.0/ 100
METRIC RATING
336th/ 347
METRIC RANK
92.3%
1 OR MORE VEHICLES IN HOUSEHOLD
99.9/ 100
METRIC RATING
35th/ 347
METRIC RANK
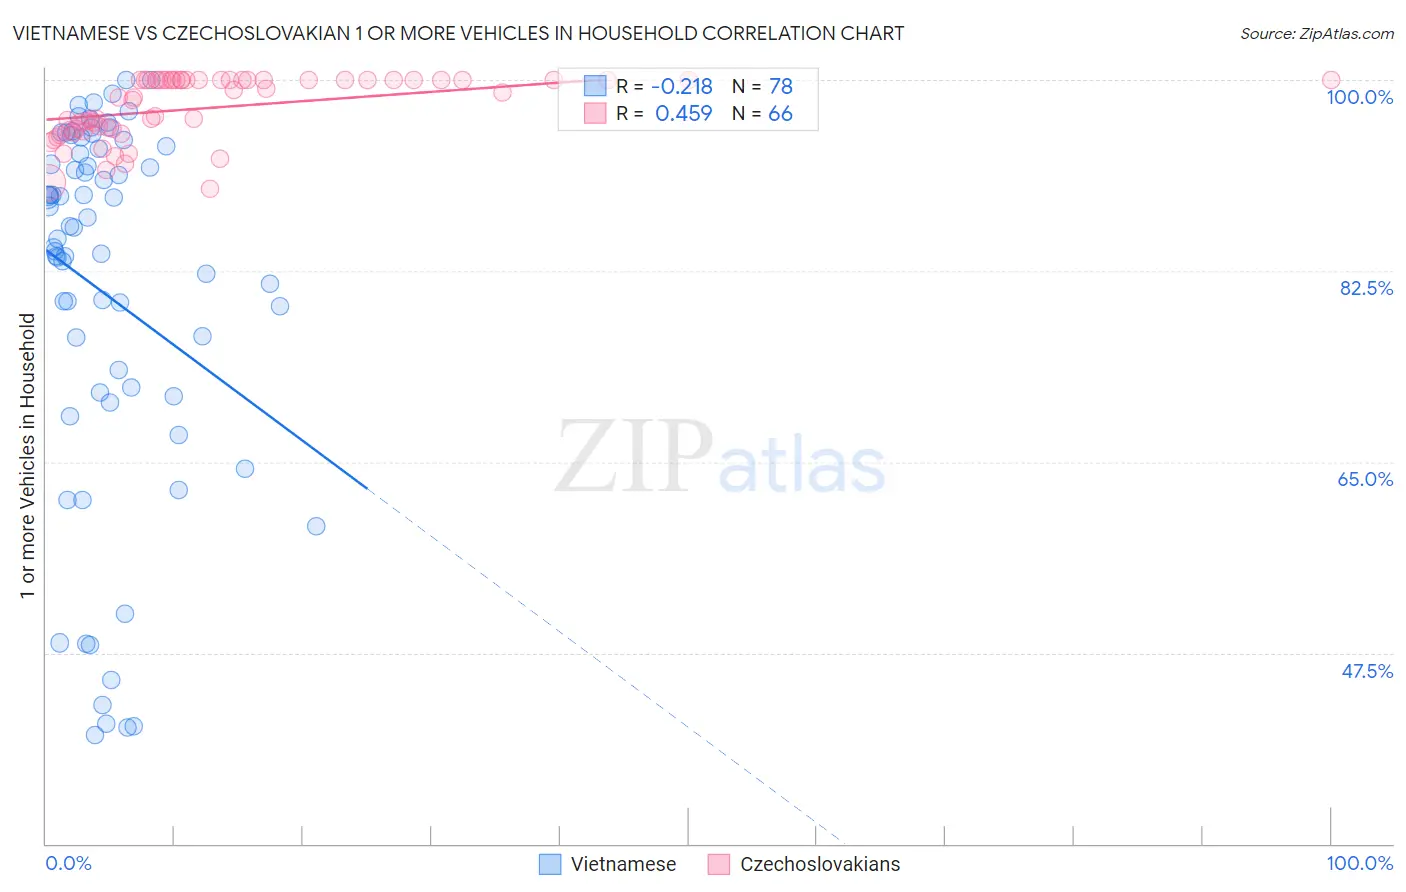
Vietnamese vs Czechoslovakian 1 or more Vehicles in Household Correlation Chart
The statistical analysis conducted on geographies consisting of 170,683,703 people shows a weak negative correlation between the proportion of Vietnamese and percentage of households with 1 or more vehicles available in the United States with a correlation coefficient (R) of -0.218 and weighted average of 73.8%. Similarly, the statistical analysis conducted on geographies consisting of 368,548,563 people shows a moderate positive correlation between the proportion of Czechoslovakians and percentage of households with 1 or more vehicles available in the United States with a correlation coefficient (R) of 0.459 and weighted average of 92.3%, a difference of 25.0%.
1 or more Vehicles in Household Correlation Summary
| Measurement | Vietnamese | Czechoslovakian |
| Minimum | 39.9% | 90.1% |
| Maximum | 100.0% | 100.0% |
| Range | 60.1% | 9.9% |
| Mean | 80.4% | 97.5% |
| Median | 86.0% | 98.7% |
| Interquartile 25% (IQ1) | 71.3% | 95.4% |
| Interquartile 75% (IQ3) | 93.7% | 100.0% |
| Interquartile Range (IQR) | 22.4% | 4.6% |
| Standard Deviation (Sample) | 17.1% | 2.9% |
| Standard Deviation (Population) | 17.0% | 2.8% |
Similar Demographics by 1 or more Vehicles in Household
Demographics Similar to Vietnamese by 1 or more Vehicles in Household
In terms of 1 or more vehicles in household, the demographic groups most similar to Vietnamese are Barbadian (74.0%, a difference of 0.21%), Immigrants from Uzbekistan (73.4%, a difference of 0.62%), Immigrants from Bangladesh (74.3%, a difference of 0.65%), Inupiat (71.5%, a difference of 3.2%), and Immigrants from Ecuador (76.2%, a difference of 3.3%).
| Demographics | Rating | Rank | 1 or more Vehicles in Household |
| Immigrants | Dominica | 0.0 /100 | #329 | Tragic 77.8% |
| Immigrants | Trinidad and Tobago | 0.0 /100 | #330 | Tragic 76.8% |
| West Indians | 0.0 /100 | #331 | Tragic 76.4% |
| Trinidadians and Tobagonians | 0.0 /100 | #332 | Tragic 76.3% |
| Immigrants | Ecuador | 0.0 /100 | #333 | Tragic 76.2% |
| Immigrants | Bangladesh | 0.0 /100 | #334 | Tragic 74.3% |
| Barbadians | 0.0 /100 | #335 | Tragic 74.0% |
| Vietnamese | 0.0 /100 | #336 | Tragic 73.8% |
| Immigrants | Uzbekistan | 0.0 /100 | #337 | Tragic 73.4% |
| Inupiat | 0.0 /100 | #338 | Tragic 71.5% |
| Guyanese | 0.0 /100 | #339 | Tragic 70.8% |
| Dominicans | 0.0 /100 | #340 | Tragic 70.7% |
| Immigrants | Barbados | 0.0 /100 | #341 | Tragic 70.6% |
| Immigrants | Guyana | 0.0 /100 | #342 | Tragic 70.6% |
| British West Indians | 0.0 /100 | #343 | Tragic 70.4% |
Demographics Similar to Czechoslovakians by 1 or more Vehicles in Household
In terms of 1 or more vehicles in household, the demographic groups most similar to Czechoslovakians are Malaysian (92.3%, a difference of 0.0%), Italian (92.3%, a difference of 0.010%), French Canadian (92.3%, a difference of 0.010%), Immigrants from Vietnam (92.3%, a difference of 0.020%), and Swiss (92.3%, a difference of 0.020%).
| Demographics | Rating | Rank | 1 or more Vehicles in Household |
| Sri Lankans | 100.0 /100 | #28 | Exceptional 92.5% |
| Native Hawaiians | 100.0 /100 | #29 | Exceptional 92.4% |
| Finns | 100.0 /100 | #30 | Exceptional 92.4% |
| Samoans | 100.0 /100 | #31 | Exceptional 92.4% |
| Basques | 100.0 /100 | #32 | Exceptional 92.4% |
| Cherokee | 100.0 /100 | #33 | Exceptional 92.4% |
| Italians | 99.9 /100 | #34 | Exceptional 92.3% |
| Czechoslovakians | 99.9 /100 | #35 | Exceptional 92.3% |
| Malaysians | 99.9 /100 | #36 | Exceptional 92.3% |
| French Canadians | 99.9 /100 | #37 | Exceptional 92.3% |
| Immigrants | Vietnam | 99.9 /100 | #38 | Exceptional 92.3% |
| Swiss | 99.9 /100 | #39 | Exceptional 92.3% |
| Creek | 99.9 /100 | #40 | Exceptional 92.3% |
| Immigrants | Taiwan | 99.9 /100 | #41 | Exceptional 92.3% |
| Chickasaw | 99.9 /100 | #42 | Exceptional 92.3% |