Immigrants from Thailand vs Immigrants from Senegal No Vehicles in Household
COMPARE
Immigrants from Thailand
Immigrants from Senegal
No Vehicles in Household
No Vehicles in Household Comparison
Immigrants from Thailand
Immigrants from Senegal
9.5%
NO VEHICLES IN HOUSEHOLD
92.6/ 100
METRIC RATING
120th/ 347
METRIC RANK
21.1%
NO VEHICLES IN HOUSEHOLD
0.0/ 100
METRIC RATING
327th/ 347
METRIC RANK
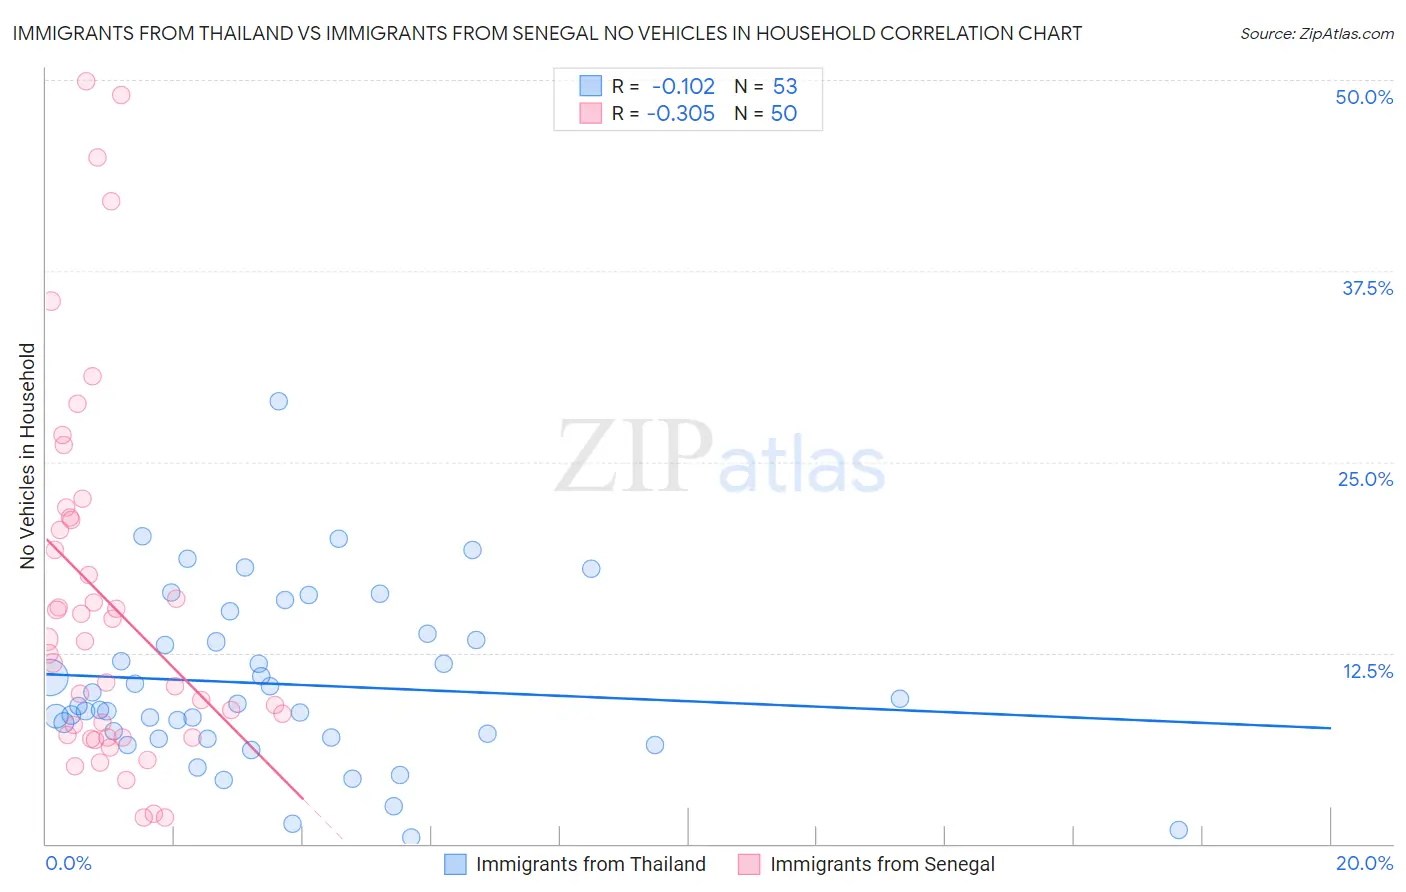
Immigrants from Thailand vs Immigrants from Senegal No Vehicles in Household Correlation Chart
The statistical analysis conducted on geographies consisting of 316,566,006 people shows a poor negative correlation between the proportion of Immigrants from Thailand and percentage of households with no vehicle available in the United States with a correlation coefficient (R) of -0.102 and weighted average of 9.5%. Similarly, the statistical analysis conducted on geographies consisting of 90,082,308 people shows a mild negative correlation between the proportion of Immigrants from Senegal and percentage of households with no vehicle available in the United States with a correlation coefficient (R) of -0.305 and weighted average of 21.1%, a difference of 122.3%.
No Vehicles in Household Correlation Summary
| Measurement | Immigrants from Thailand | Immigrants from Senegal |
| Minimum | 0.37% | 1.7% |
| Maximum | 29.0% | 49.9% |
| Range | 28.6% | 48.2% |
| Mean | 10.5% | 15.8% |
| Median | 9.0% | 12.8% |
| Interquartile 25% (IQ1) | 6.9% | 7.0% |
| Interquartile 75% (IQ3) | 13.5% | 21.2% |
| Interquartile Range (IQR) | 6.6% | 14.2% |
| Standard Deviation (Sample) | 5.6% | 12.0% |
| Standard Deviation (Population) | 5.5% | 11.9% |
Similar Demographics by No Vehicles in Household
Demographics Similar to Immigrants from Thailand by No Vehicles in Household
In terms of no vehicles in household, the demographic groups most similar to Immigrants from Thailand are Fijian (9.5%, a difference of 0.060%), Puget Sound Salish (9.5%, a difference of 0.10%), Costa Rican (9.5%, a difference of 0.15%), Greek (9.5%, a difference of 0.17%), and Blackfeet (9.6%, a difference of 0.61%).
| Demographics | Rating | Rank | No Vehicles in Household |
| Immigrants | Netherlands | 94.8 /100 | #113 | Exceptional 9.4% |
| Serbians | 94.3 /100 | #114 | Exceptional 9.4% |
| Navajo | 94.2 /100 | #115 | Exceptional 9.4% |
| Japanese | 94.1 /100 | #116 | Exceptional 9.4% |
| Chippewa | 93.8 /100 | #117 | Exceptional 9.4% |
| Greeks | 92.9 /100 | #118 | Exceptional 9.5% |
| Fijians | 92.7 /100 | #119 | Exceptional 9.5% |
| Immigrants | Thailand | 92.6 /100 | #120 | Exceptional 9.5% |
| Puget Sound Salish | 92.4 /100 | #121 | Exceptional 9.5% |
| Costa Ricans | 92.3 /100 | #122 | Exceptional 9.5% |
| Blackfeet | 91.4 /100 | #123 | Exceptional 9.6% |
| Immigrants | Korea | 90.9 /100 | #124 | Exceptional 9.6% |
| Immigrants | Cameroon | 90.6 /100 | #125 | Exceptional 9.6% |
| Icelanders | 90.2 /100 | #126 | Exceptional 9.6% |
| Immigrants | Kenya | 89.7 /100 | #127 | Excellent 9.6% |
Demographics Similar to Immigrants from Senegal by No Vehicles in Household
In terms of no vehicles in household, the demographic groups most similar to Immigrants from Senegal are Immigrants from West Indies (20.5%, a difference of 3.0%), Immigrants from Dominica (22.2%, a difference of 5.1%), Senegalese (19.8%, a difference of 7.0%), Ecuadorian (22.8%, a difference of 7.6%), and Immigrants from Caribbean (19.6%, a difference of 7.8%).
| Demographics | Rating | Rank | No Vehicles in Household |
| Soviet Union | 0.0 /100 | #320 | Tragic 17.4% |
| Jamaicans | 0.0 /100 | #321 | Tragic 17.9% |
| Immigrants | Cabo Verde | 0.0 /100 | #322 | Tragic 18.4% |
| Immigrants | Yemen | 0.0 /100 | #323 | Tragic 19.5% |
| Immigrants | Caribbean | 0.0 /100 | #324 | Tragic 19.6% |
| Senegalese | 0.0 /100 | #325 | Tragic 19.8% |
| Immigrants | West Indies | 0.0 /100 | #326 | Tragic 20.5% |
| Immigrants | Senegal | 0.0 /100 | #327 | Tragic 21.1% |
| Immigrants | Dominica | 0.0 /100 | #328 | Tragic 22.2% |
| Ecuadorians | 0.0 /100 | #329 | Tragic 22.8% |
| West Indians | 0.0 /100 | #330 | Tragic 23.7% |
| Trinidadians and Tobagonians | 0.0 /100 | #331 | Tragic 23.7% |
| Immigrants | Ecuador | 0.0 /100 | #332 | Tragic 23.8% |
| Immigrants | Trinidad and Tobago | 0.0 /100 | #333 | Tragic 24.6% |
| Immigrants | Bangladesh | 0.0 /100 | #334 | Tragic 25.8% |