Immigrants from Thailand vs Immigrants from Somalia 4 or more Vehicles in Household
COMPARE
Immigrants from Thailand
Immigrants from Somalia
4 or more Vehicles in Household
4 or more Vehicles in Household Comparison
Immigrants from Thailand
Immigrants from Somalia
6.9%
4 OR MORE VEHICLES IN HOUSEHOLD
97.0/ 100
METRIC RATING
110th/ 347
METRIC RANK
4.9%
4 OR MORE VEHICLES IN HOUSEHOLD
0.0/ 100
METRIC RATING
309th/ 347
METRIC RANK
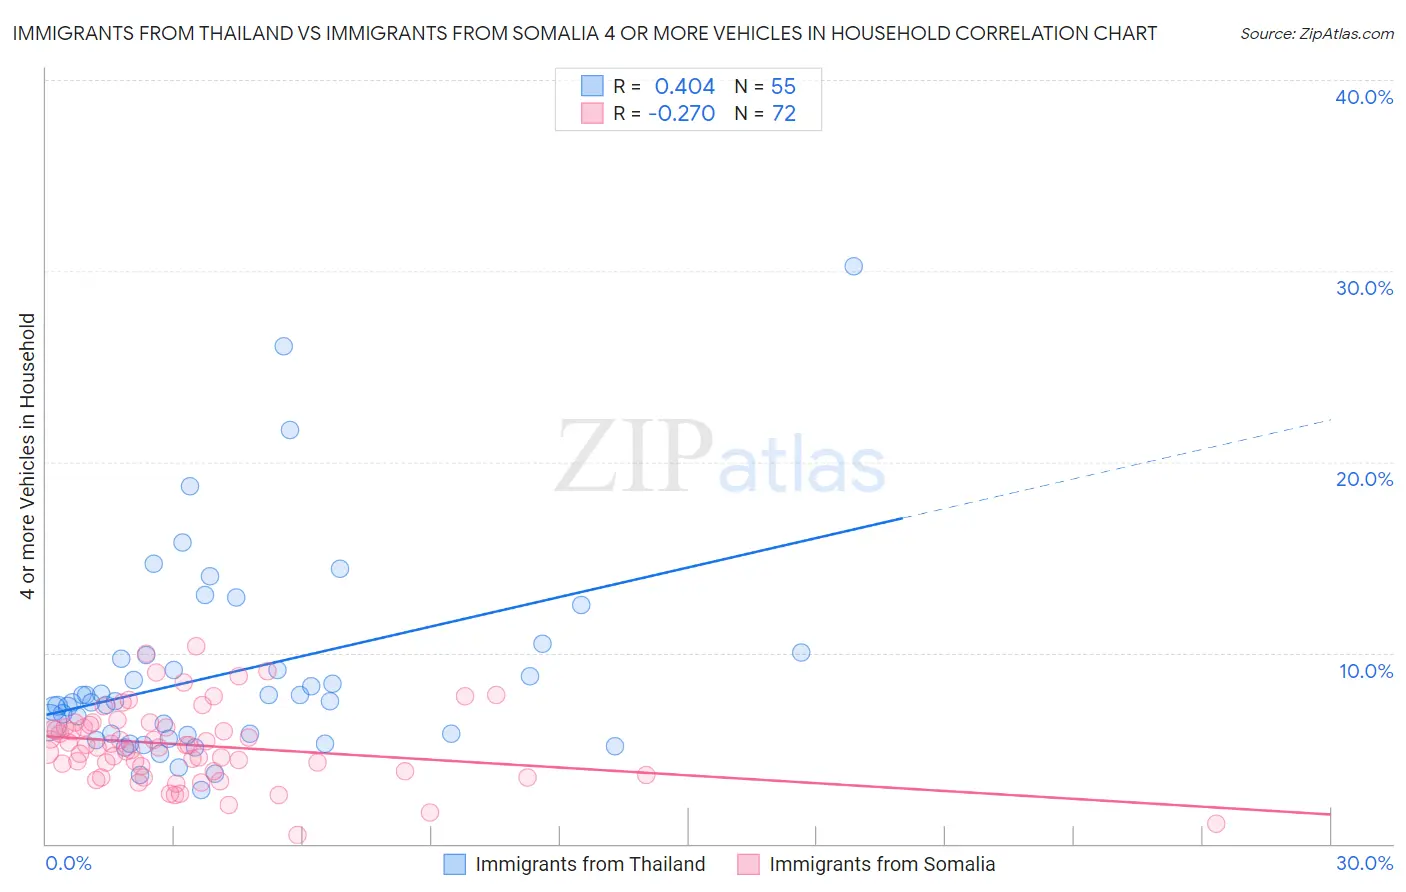
Immigrants from Thailand vs Immigrants from Somalia 4 or more Vehicles in Household Correlation Chart
The statistical analysis conducted on geographies consisting of 315,917,878 people shows a moderate positive correlation between the proportion of Immigrants from Thailand and percentage of households with 4 or more vehicles available in the United States with a correlation coefficient (R) of 0.404 and weighted average of 6.9%. Similarly, the statistical analysis conducted on geographies consisting of 91,954,099 people shows a weak negative correlation between the proportion of Immigrants from Somalia and percentage of households with 4 or more vehicles available in the United States with a correlation coefficient (R) of -0.270 and weighted average of 4.9%, a difference of 39.6%.
4 or more Vehicles in Household Correlation Summary
| Measurement | Immigrants from Thailand | Immigrants from Somalia |
| Minimum | 2.8% | 0.49% |
| Maximum | 30.2% | 10.4% |
| Range | 27.4% | 9.9% |
| Mean | 9.0% | 5.2% |
| Median | 7.5% | 5.1% |
| Interquartile 25% (IQ1) | 5.7% | 3.8% |
| Interquartile 75% (IQ3) | 9.9% | 6.2% |
| Interquartile Range (IQR) | 4.2% | 2.4% |
| Standard Deviation (Sample) | 5.3% | 2.0% |
| Standard Deviation (Population) | 5.3% | 2.0% |
Similar Demographics by 4 or more Vehicles in Household
Demographics Similar to Immigrants from Thailand by 4 or more Vehicles in Household
In terms of 4 or more vehicles in household, the demographic groups most similar to Immigrants from Thailand are Aleut (6.9%, a difference of 0.020%), Hopi (6.9%, a difference of 0.030%), Canadian (6.9%, a difference of 0.45%), Filipino (6.9%, a difference of 0.50%), and Bolivian (6.8%, a difference of 0.50%).
| Demographics | Rating | Rank | 4 or more Vehicles in Household |
| Blackfeet | 98.6 /100 | #103 | Exceptional 7.0% |
| Hmong | 98.3 /100 | #104 | Exceptional 7.0% |
| German Russians | 98.3 /100 | #105 | Exceptional 7.0% |
| Guatemalans | 98.1 /100 | #106 | Exceptional 7.0% |
| Nicaraguans | 98.0 /100 | #107 | Exceptional 7.0% |
| French | 97.7 /100 | #108 | Exceptional 6.9% |
| Filipinos | 97.6 /100 | #109 | Exceptional 6.9% |
| Immigrants | Thailand | 97.0 /100 | #110 | Exceptional 6.9% |
| Aleuts | 97.0 /100 | #111 | Exceptional 6.9% |
| Hopi | 97.0 /100 | #112 | Exceptional 6.9% |
| Canadians | 96.4 /100 | #113 | Exceptional 6.9% |
| Bolivians | 96.3 /100 | #114 | Exceptional 6.8% |
| Tlingit-Haida | 96.2 /100 | #115 | Exceptional 6.8% |
| Immigrants | Guatemala | 95.8 /100 | #116 | Exceptional 6.8% |
| Burmese | 95.7 /100 | #117 | Exceptional 6.8% |
Demographics Similar to Immigrants from Somalia by 4 or more Vehicles in Household
In terms of 4 or more vehicles in household, the demographic groups most similar to Immigrants from Somalia are Paraguayan (4.9%, a difference of 0.15%), Moroccan (4.9%, a difference of 0.38%), Houma (4.9%, a difference of 0.39%), Menominee (5.0%, a difference of 0.87%), and Immigrants from Serbia (5.0%, a difference of 1.8%).
| Demographics | Rating | Rank | 4 or more Vehicles in Household |
| Bahamians | 0.0 /100 | #302 | Tragic 5.1% |
| Immigrants | Greece | 0.0 /100 | #303 | Tragic 5.1% |
| Cypriots | 0.0 /100 | #304 | Tragic 5.0% |
| Somalis | 0.0 /100 | #305 | Tragic 5.0% |
| Immigrants | Serbia | 0.0 /100 | #306 | Tragic 5.0% |
| Menominee | 0.0 /100 | #307 | Tragic 5.0% |
| Paraguayans | 0.0 /100 | #308 | Tragic 4.9% |
| Immigrants | Somalia | 0.0 /100 | #309 | Tragic 4.9% |
| Moroccans | 0.0 /100 | #310 | Tragic 4.9% |
| Houma | 0.0 /100 | #311 | Tragic 4.9% |
| Albanians | 0.0 /100 | #312 | Tragic 4.8% |
| Immigrants | Israel | 0.0 /100 | #313 | Tragic 4.8% |
| Immigrants | West Indies | 0.0 /100 | #314 | Tragic 4.7% |
| Immigrants | Belarus | 0.0 /100 | #315 | Tragic 4.7% |
| Puerto Ricans | 0.0 /100 | #316 | Tragic 4.7% |