Immigrants from Thailand vs Immigrants from Kenya 4 or more Vehicles in Household
COMPARE
Immigrants from Thailand
Immigrants from Kenya
4 or more Vehicles in Household
4 or more Vehicles in Household Comparison
Immigrants from Thailand
Immigrants from Kenya
6.9%
4 OR MORE VEHICLES IN HOUSEHOLD
97.0/ 100
METRIC RATING
110th/ 347
METRIC RANK
6.0%
4 OR MORE VEHICLES IN HOUSEHOLD
9.2/ 100
METRIC RATING
223rd/ 347
METRIC RANK
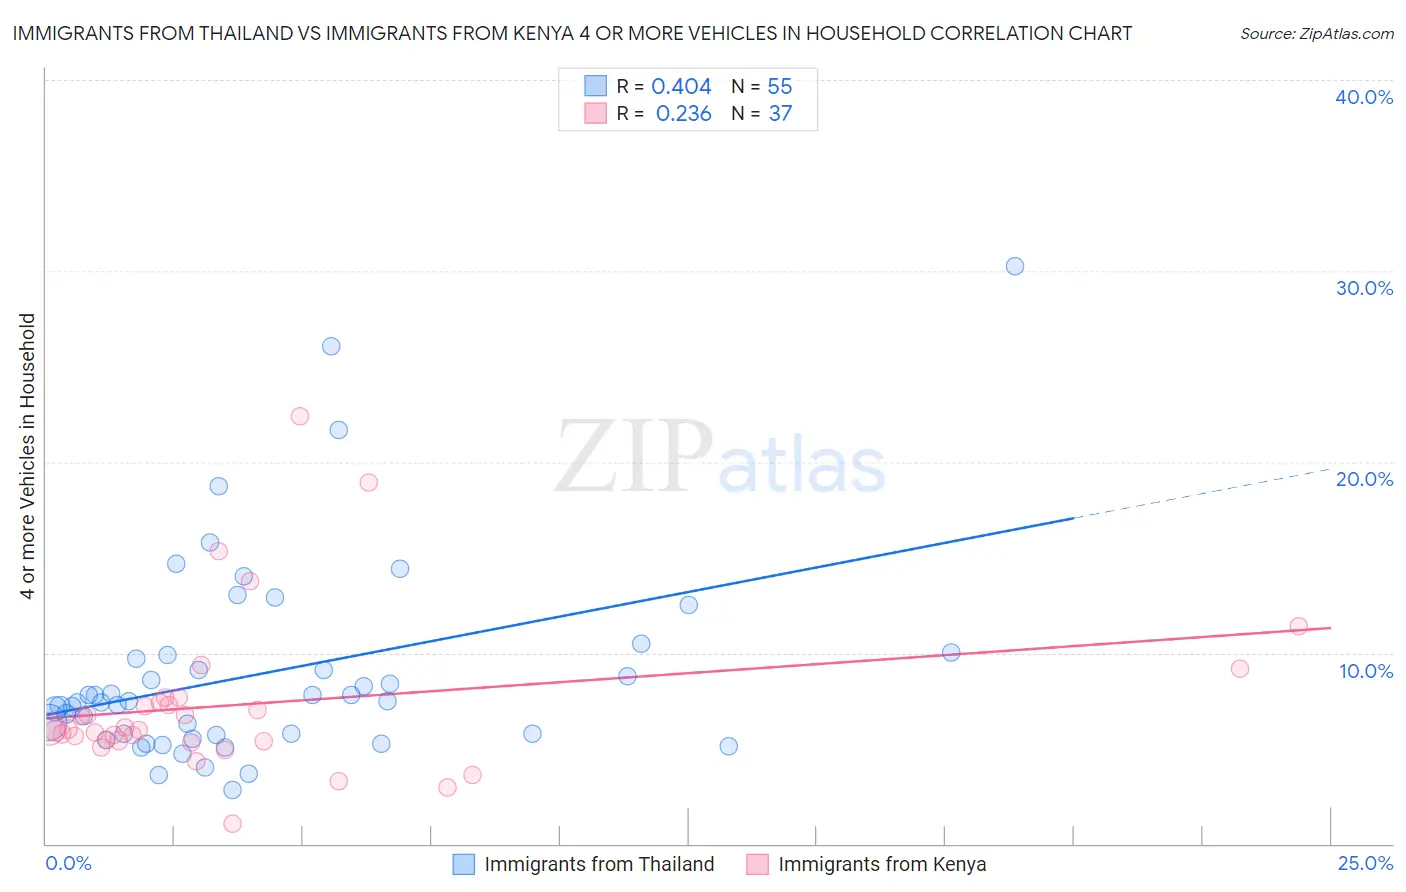
Immigrants from Thailand vs Immigrants from Kenya 4 or more Vehicles in Household Correlation Chart
The statistical analysis conducted on geographies consisting of 315,917,878 people shows a moderate positive correlation between the proportion of Immigrants from Thailand and percentage of households with 4 or more vehicles available in the United States with a correlation coefficient (R) of 0.404 and weighted average of 6.9%. Similarly, the statistical analysis conducted on geographies consisting of 217,337,242 people shows a weak positive correlation between the proportion of Immigrants from Kenya and percentage of households with 4 or more vehicles available in the United States with a correlation coefficient (R) of 0.236 and weighted average of 6.0%, a difference of 15.5%.
4 or more Vehicles in Household Correlation Summary
| Measurement | Immigrants from Thailand | Immigrants from Kenya |
| Minimum | 2.8% | 1.0% |
| Maximum | 30.2% | 22.4% |
| Range | 27.4% | 21.3% |
| Mean | 9.0% | 7.3% |
| Median | 7.5% | 6.0% |
| Interquartile 25% (IQ1) | 5.7% | 5.4% |
| Interquartile 75% (IQ3) | 9.9% | 7.5% |
| Interquartile Range (IQR) | 4.2% | 2.1% |
| Standard Deviation (Sample) | 5.3% | 4.2% |
| Standard Deviation (Population) | 5.3% | 4.1% |
Similar Demographics by 4 or more Vehicles in Household
Demographics Similar to Immigrants from Thailand by 4 or more Vehicles in Household
In terms of 4 or more vehicles in household, the demographic groups most similar to Immigrants from Thailand are Aleut (6.9%, a difference of 0.020%), Hopi (6.9%, a difference of 0.030%), Canadian (6.9%, a difference of 0.45%), Filipino (6.9%, a difference of 0.50%), and Bolivian (6.8%, a difference of 0.50%).
| Demographics | Rating | Rank | 4 or more Vehicles in Household |
| Blackfeet | 98.6 /100 | #103 | Exceptional 7.0% |
| Hmong | 98.3 /100 | #104 | Exceptional 7.0% |
| German Russians | 98.3 /100 | #105 | Exceptional 7.0% |
| Guatemalans | 98.1 /100 | #106 | Exceptional 7.0% |
| Nicaraguans | 98.0 /100 | #107 | Exceptional 7.0% |
| French | 97.7 /100 | #108 | Exceptional 6.9% |
| Filipinos | 97.6 /100 | #109 | Exceptional 6.9% |
| Immigrants | Thailand | 97.0 /100 | #110 | Exceptional 6.9% |
| Aleuts | 97.0 /100 | #111 | Exceptional 6.9% |
| Hopi | 97.0 /100 | #112 | Exceptional 6.9% |
| Canadians | 96.4 /100 | #113 | Exceptional 6.9% |
| Bolivians | 96.3 /100 | #114 | Exceptional 6.8% |
| Tlingit-Haida | 96.2 /100 | #115 | Exceptional 6.8% |
| Immigrants | Guatemala | 95.8 /100 | #116 | Exceptional 6.8% |
| Burmese | 95.7 /100 | #117 | Exceptional 6.8% |
Demographics Similar to Immigrants from Kenya by 4 or more Vehicles in Household
In terms of 4 or more vehicles in household, the demographic groups most similar to Immigrants from Kenya are Cajun (6.0%, a difference of 0.0%), Cuban (6.0%, a difference of 0.010%), Immigrants from Moldova (6.0%, a difference of 0.030%), Indonesian (6.0%, a difference of 0.090%), and Russian (6.0%, a difference of 0.33%).
| Demographics | Rating | Rank | 4 or more Vehicles in Household |
| Immigrants | Romania | 13.8 /100 | #216 | Poor 6.0% |
| Nigerians | 12.2 /100 | #217 | Poor 6.0% |
| Immigrants | Italy | 11.0 /100 | #218 | Poor 6.0% |
| Serbians | 11.0 /100 | #219 | Poor 6.0% |
| Russians | 10.3 /100 | #220 | Poor 6.0% |
| Immigrants | Moldova | 9.3 /100 | #221 | Tragic 6.0% |
| Cajuns | 9.2 /100 | #222 | Tragic 6.0% |
| Immigrants | Kenya | 9.2 /100 | #223 | Tragic 6.0% |
| Cubans | 9.2 /100 | #224 | Tragic 6.0% |
| Indonesians | 8.9 /100 | #225 | Tragic 6.0% |
| Immigrants | Singapore | 7.9 /100 | #226 | Tragic 5.9% |
| Immigrants | Western Asia | 7.8 /100 | #227 | Tragic 5.9% |
| Immigrants | Uganda | 7.5 /100 | #228 | Tragic 5.9% |
| Eastern Europeans | 6.8 /100 | #229 | Tragic 5.9% |
| Immigrants | Malaysia | 6.7 /100 | #230 | Tragic 5.9% |