Immigrants from Syria vs Immigrants from Ethiopia 1 or more Vehicles in Household
COMPARE
Immigrants from Syria
Immigrants from Ethiopia
1 or more Vehicles in Household
1 or more Vehicles in Household Comparison
Immigrants from Syria
Immigrants from Ethiopia
90.4%
1 OR MORE VEHICLES IN HOUSEHOLD
87.5/ 100
METRIC RATING
133rd/ 347
METRIC RANK
89.6%
1 OR MORE VEHICLES IN HOUSEHOLD
42.5/ 100
METRIC RATING
181st/ 347
METRIC RANK
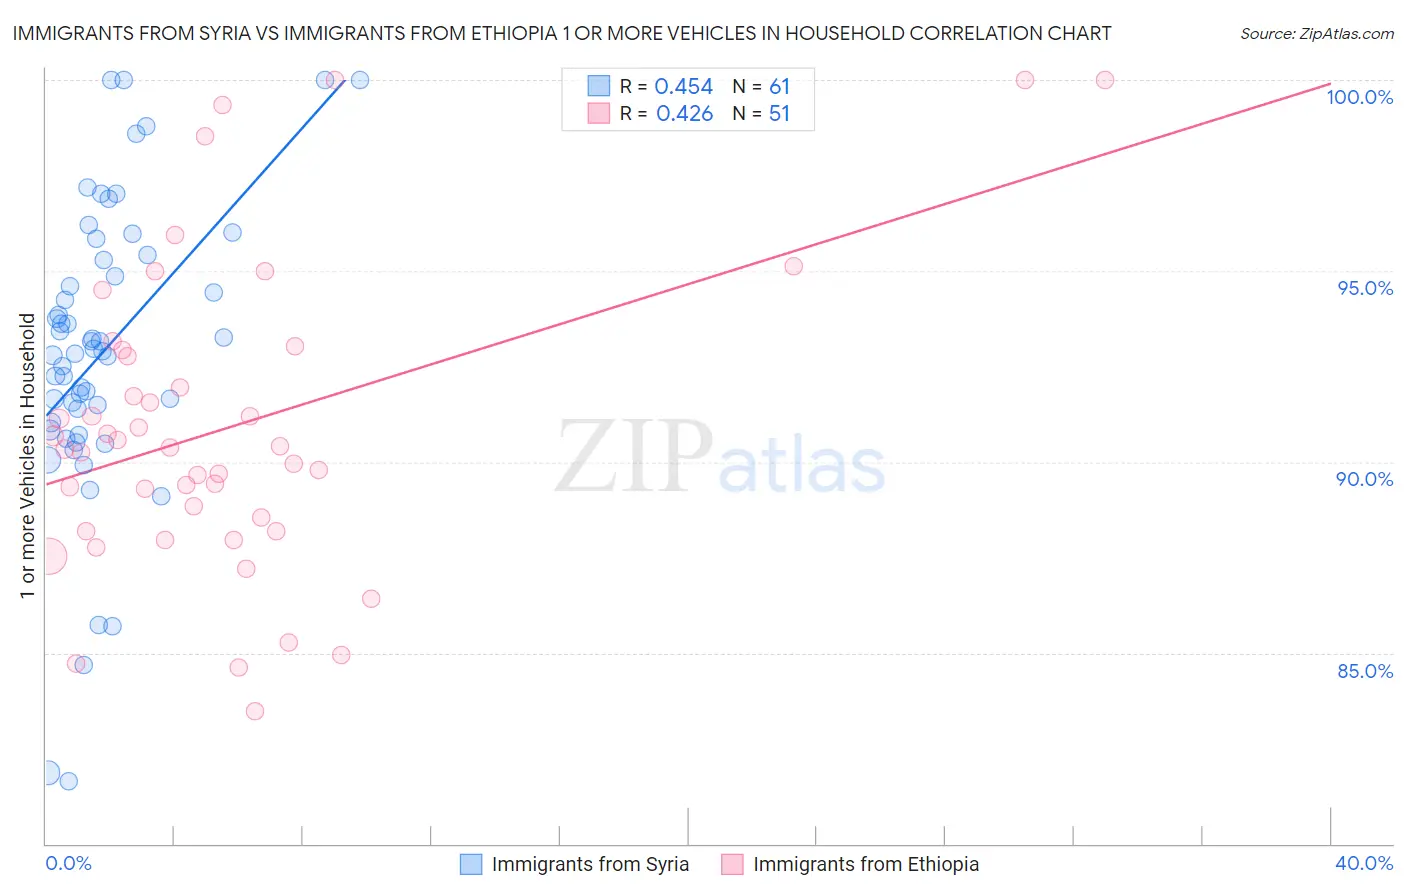
Immigrants from Syria vs Immigrants from Ethiopia 1 or more Vehicles in Household Correlation Chart
The statistical analysis conducted on geographies consisting of 174,034,006 people shows a moderate positive correlation between the proportion of Immigrants from Syria and percentage of households with 1 or more vehicles available in the United States with a correlation coefficient (R) of 0.454 and weighted average of 90.4%. Similarly, the statistical analysis conducted on geographies consisting of 211,422,561 people shows a moderate positive correlation between the proportion of Immigrants from Ethiopia and percentage of households with 1 or more vehicles available in the United States with a correlation coefficient (R) of 0.426 and weighted average of 89.6%, a difference of 0.87%.
1 or more Vehicles in Household Correlation Summary
| Measurement | Immigrants from Syria | Immigrants from Ethiopia |
| Minimum | 81.7% | 83.5% |
| Maximum | 100.0% | 100.0% |
| Range | 18.3% | 16.5% |
| Mean | 92.9% | 90.9% |
| Median | 92.9% | 90.4% |
| Interquartile 25% (IQ1) | 90.9% | 88.2% |
| Interquartile 75% (IQ3) | 95.3% | 92.9% |
| Interquartile Range (IQR) | 4.4% | 4.7% |
| Standard Deviation (Sample) | 3.9% | 4.0% |
| Standard Deviation (Population) | 3.9% | 4.0% |
Similar Demographics by 1 or more Vehicles in Household
Demographics Similar to Immigrants from Syria by 1 or more Vehicles in Household
In terms of 1 or more vehicles in household, the demographic groups most similar to Immigrants from Syria are Immigrants from South Africa (90.4%, a difference of 0.020%), Kenyan (90.4%, a difference of 0.020%), Immigrants from Oceania (90.4%, a difference of 0.020%), Immigrants from Kenya (90.4%, a difference of 0.040%), and Hungarian (90.3%, a difference of 0.040%).
| Demographics | Rating | Rank | 1 or more Vehicles in Household |
| Immigrants | Cameroon | 89.4 /100 | #126 | Excellent 90.4% |
| Immigrants | Azores | 89.1 /100 | #127 | Excellent 90.4% |
| Burmese | 89.0 /100 | #128 | Excellent 90.4% |
| Marshallese | 88.9 /100 | #129 | Excellent 90.4% |
| Nicaraguans | 88.8 /100 | #130 | Excellent 90.4% |
| Immigrants | Kenya | 88.5 /100 | #131 | Excellent 90.4% |
| Immigrants | South Africa | 88.1 /100 | #132 | Excellent 90.4% |
| Immigrants | Syria | 87.5 /100 | #133 | Excellent 90.4% |
| Kenyans | 87.0 /100 | #134 | Excellent 90.4% |
| Immigrants | Oceania | 86.9 /100 | #135 | Excellent 90.4% |
| Hungarians | 86.5 /100 | #136 | Excellent 90.3% |
| Latvians | 86.3 /100 | #137 | Excellent 90.3% |
| Syrians | 86.3 /100 | #138 | Excellent 90.3% |
| Estonians | 85.6 /100 | #139 | Excellent 90.3% |
| Sudanese | 85.2 /100 | #140 | Excellent 90.3% |
Demographics Similar to Immigrants from Ethiopia by 1 or more Vehicles in Household
In terms of 1 or more vehicles in household, the demographic groups most similar to Immigrants from Ethiopia are Ukrainian (89.6%, a difference of 0.0%), Arab (89.6%, a difference of 0.010%), German Russian (89.6%, a difference of 0.020%), Ethiopian (89.6%, a difference of 0.020%), and Immigrants from El Salvador (89.6%, a difference of 0.030%).
| Demographics | Rating | Rank | 1 or more Vehicles in Household |
| Filipinos | 50.0 /100 | #174 | Average 89.7% |
| Immigrants | Burma/Myanmar | 47.6 /100 | #175 | Average 89.7% |
| Immigrants | Sudan | 47.1 /100 | #176 | Average 89.7% |
| Hmong | 45.8 /100 | #177 | Average 89.6% |
| Immigrants | El Salvador | 44.1 /100 | #178 | Average 89.6% |
| German Russians | 44.0 /100 | #179 | Average 89.6% |
| Arabs | 43.3 /100 | #180 | Average 89.6% |
| Immigrants | Ethiopia | 42.5 /100 | #181 | Average 89.6% |
| Ukrainians | 42.4 /100 | #182 | Average 89.6% |
| Ethiopians | 41.2 /100 | #183 | Average 89.6% |
| Immigrants | Bulgaria | 40.7 /100 | #184 | Average 89.6% |
| Immigrants | Brazil | 40.1 /100 | #185 | Average 89.6% |
| Pueblo | 39.9 /100 | #186 | Fair 89.6% |
| South Americans | 39.6 /100 | #187 | Fair 89.5% |
| Immigrants | Nepal | 38.9 /100 | #188 | Fair 89.5% |