Immigrants from Syria vs Immigrants from Barbados 1 or more Vehicles in Household
COMPARE
Immigrants from Syria
Immigrants from Barbados
1 or more Vehicles in Household
1 or more Vehicles in Household Comparison
Immigrants from Syria
Immigrants from Barbados
90.4%
1 OR MORE VEHICLES IN HOUSEHOLD
87.5/ 100
METRIC RATING
133rd/ 347
METRIC RANK
70.6%
1 OR MORE VEHICLES IN HOUSEHOLD
0.0/ 100
METRIC RATING
341st/ 347
METRIC RANK
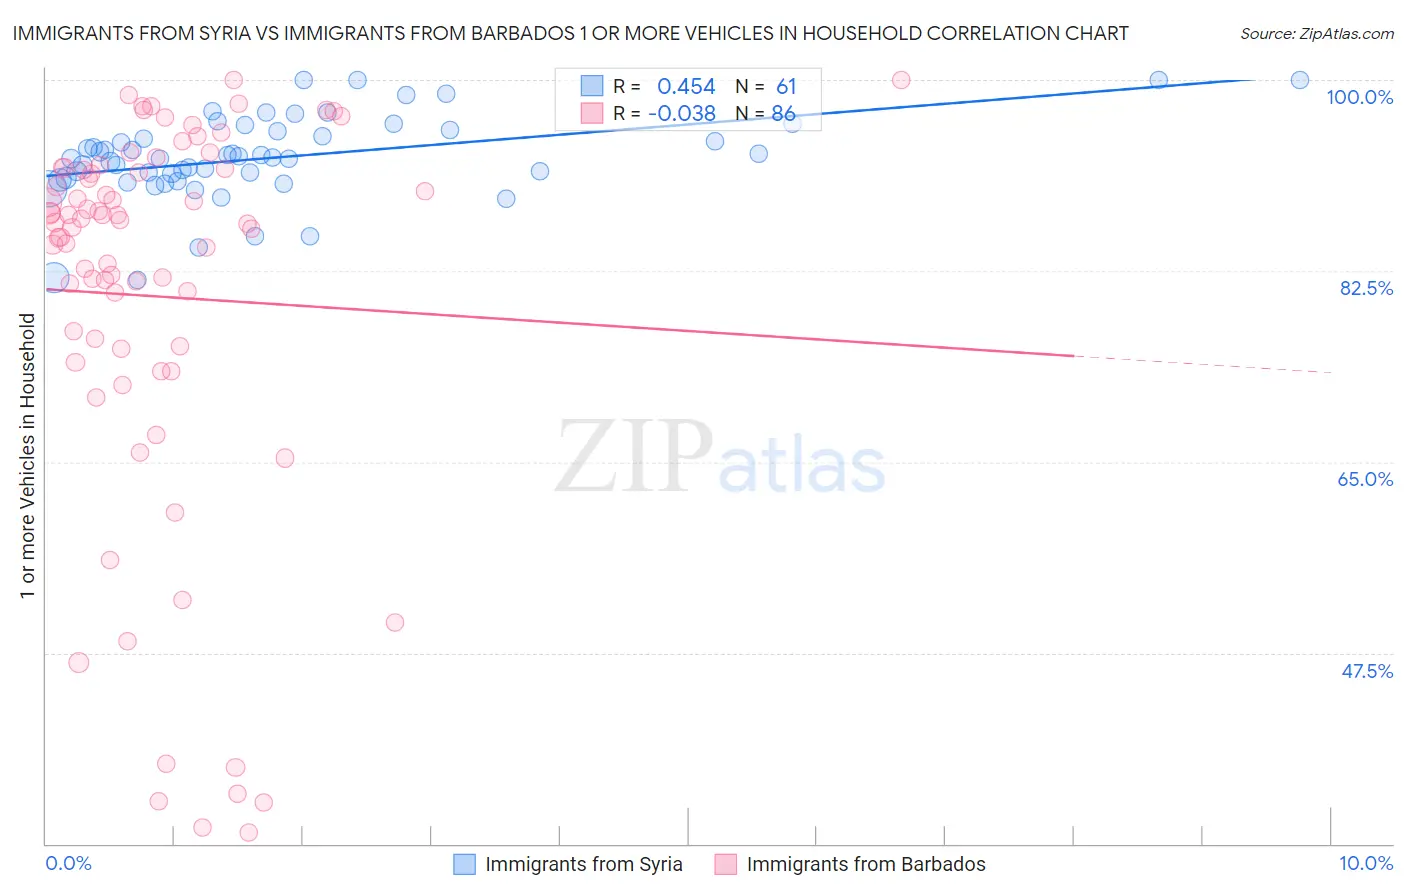
Immigrants from Syria vs Immigrants from Barbados 1 or more Vehicles in Household Correlation Chart
The statistical analysis conducted on geographies consisting of 174,034,006 people shows a moderate positive correlation between the proportion of Immigrants from Syria and percentage of households with 1 or more vehicles available in the United States with a correlation coefficient (R) of 0.454 and weighted average of 90.4%. Similarly, the statistical analysis conducted on geographies consisting of 112,776,758 people shows no correlation between the proportion of Immigrants from Barbados and percentage of households with 1 or more vehicles available in the United States with a correlation coefficient (R) of -0.038 and weighted average of 70.6%, a difference of 28.0%.
1 or more Vehicles in Household Correlation Summary
| Measurement | Immigrants from Syria | Immigrants from Barbados |
| Minimum | 81.7% | 31.0% |
| Maximum | 100.0% | 100.0% |
| Range | 18.3% | 69.0% |
| Mean | 92.9% | 80.2% |
| Median | 92.9% | 86.9% |
| Interquartile 25% (IQ1) | 90.9% | 75.4% |
| Interquartile 75% (IQ3) | 95.3% | 91.9% |
| Interquartile Range (IQR) | 4.4% | 16.5% |
| Standard Deviation (Sample) | 3.9% | 18.1% |
| Standard Deviation (Population) | 3.9% | 18.0% |
Similar Demographics by 1 or more Vehicles in Household
Demographics Similar to Immigrants from Syria by 1 or more Vehicles in Household
In terms of 1 or more vehicles in household, the demographic groups most similar to Immigrants from Syria are Immigrants from South Africa (90.4%, a difference of 0.020%), Kenyan (90.4%, a difference of 0.020%), Immigrants from Oceania (90.4%, a difference of 0.020%), Immigrants from Kenya (90.4%, a difference of 0.040%), and Hungarian (90.3%, a difference of 0.040%).
| Demographics | Rating | Rank | 1 or more Vehicles in Household |
| Immigrants | Cameroon | 89.4 /100 | #126 | Excellent 90.4% |
| Immigrants | Azores | 89.1 /100 | #127 | Excellent 90.4% |
| Burmese | 89.0 /100 | #128 | Excellent 90.4% |
| Marshallese | 88.9 /100 | #129 | Excellent 90.4% |
| Nicaraguans | 88.8 /100 | #130 | Excellent 90.4% |
| Immigrants | Kenya | 88.5 /100 | #131 | Excellent 90.4% |
| Immigrants | South Africa | 88.1 /100 | #132 | Excellent 90.4% |
| Immigrants | Syria | 87.5 /100 | #133 | Excellent 90.4% |
| Kenyans | 87.0 /100 | #134 | Excellent 90.4% |
| Immigrants | Oceania | 86.9 /100 | #135 | Excellent 90.4% |
| Hungarians | 86.5 /100 | #136 | Excellent 90.3% |
| Latvians | 86.3 /100 | #137 | Excellent 90.3% |
| Syrians | 86.3 /100 | #138 | Excellent 90.3% |
| Estonians | 85.6 /100 | #139 | Excellent 90.3% |
| Sudanese | 85.2 /100 | #140 | Excellent 90.3% |
Demographics Similar to Immigrants from Barbados by 1 or more Vehicles in Household
In terms of 1 or more vehicles in household, the demographic groups most similar to Immigrants from Barbados are Immigrants from Guyana (70.6%, a difference of 0.010%), Dominican (70.7%, a difference of 0.13%), Guyanese (70.8%, a difference of 0.32%), British West Indian (70.4%, a difference of 0.32%), and Inupiat (71.5%, a difference of 1.3%).
| Demographics | Rating | Rank | 1 or more Vehicles in Household |
| Immigrants | Ecuador | 0.0 /100 | #333 | Tragic 76.2% |
| Immigrants | Bangladesh | 0.0 /100 | #334 | Tragic 74.3% |
| Barbadians | 0.0 /100 | #335 | Tragic 74.0% |
| Vietnamese | 0.0 /100 | #336 | Tragic 73.8% |
| Immigrants | Uzbekistan | 0.0 /100 | #337 | Tragic 73.4% |
| Inupiat | 0.0 /100 | #338 | Tragic 71.5% |
| Guyanese | 0.0 /100 | #339 | Tragic 70.8% |
| Dominicans | 0.0 /100 | #340 | Tragic 70.7% |
| Immigrants | Barbados | 0.0 /100 | #341 | Tragic 70.6% |
| Immigrants | Guyana | 0.0 /100 | #342 | Tragic 70.6% |
| British West Indians | 0.0 /100 | #343 | Tragic 70.4% |
| Immigrants | Dominican Republic | 0.0 /100 | #344 | Tragic 68.6% |
| Immigrants | St. Vincent and the Grenadines | 0.0 /100 | #345 | Tragic 64.7% |
| Immigrants | Grenada | 0.0 /100 | #346 | Tragic 62.7% |
| Yup'ik | 0.0 /100 | #347 | Tragic 58.4% |