Immigrants from Syria vs Immigrants from Hungary 1 or more Vehicles in Household
COMPARE
Immigrants from Syria
Immigrants from Hungary
1 or more Vehicles in Household
1 or more Vehicles in Household Comparison
Immigrants from Syria
Immigrants from Hungary
90.4%
1 OR MORE VEHICLES IN HOUSEHOLD
87.5/ 100
METRIC RATING
133rd/ 347
METRIC RANK
89.0%
1 OR MORE VEHICLES IN HOUSEHOLD
11.9/ 100
METRIC RATING
214th/ 347
METRIC RANK
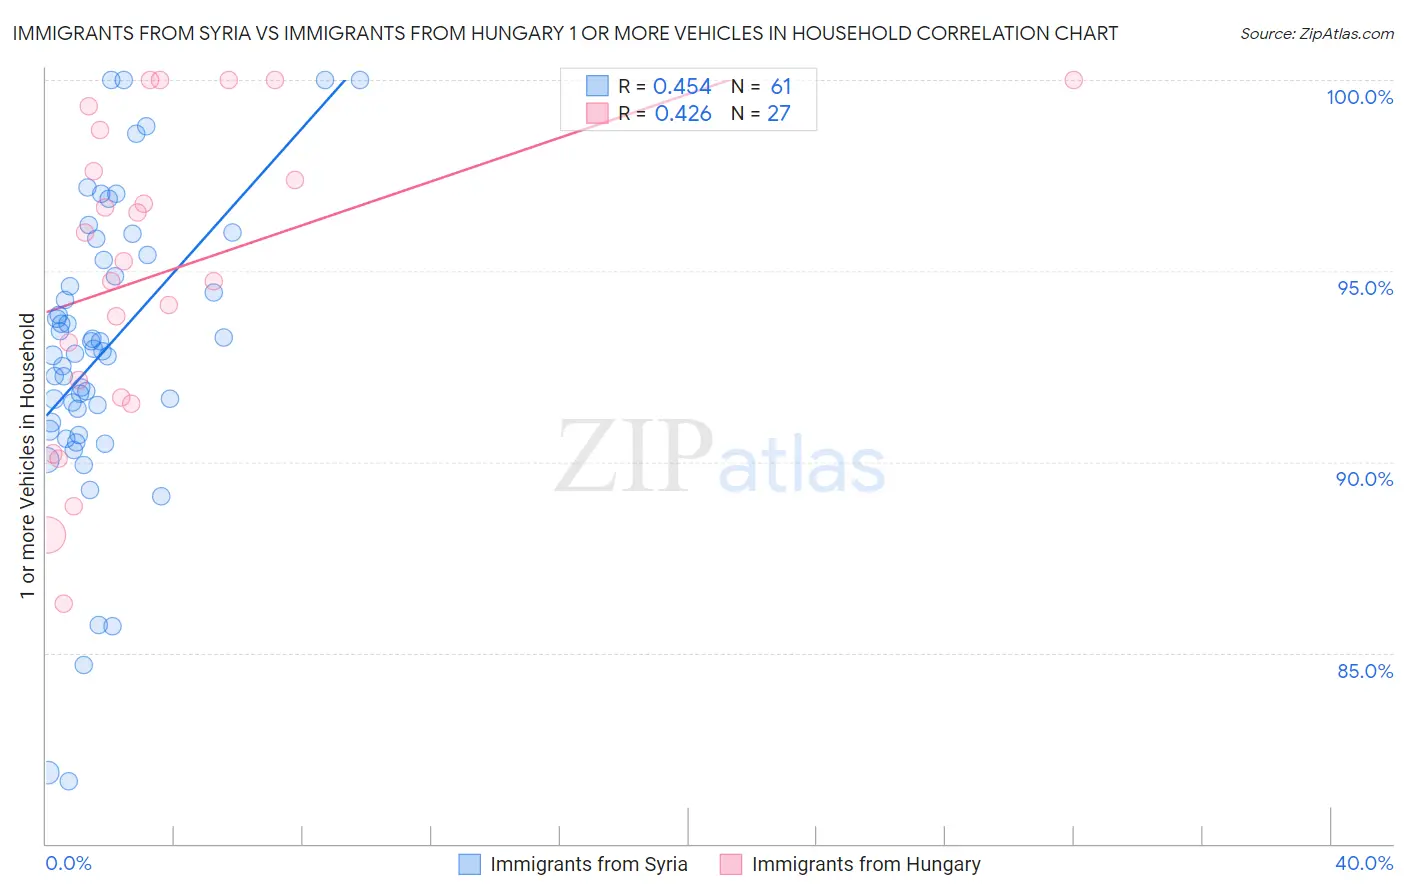
Immigrants from Syria vs Immigrants from Hungary 1 or more Vehicles in Household Correlation Chart
The statistical analysis conducted on geographies consisting of 174,034,006 people shows a moderate positive correlation between the proportion of Immigrants from Syria and percentage of households with 1 or more vehicles available in the United States with a correlation coefficient (R) of 0.454 and weighted average of 90.4%. Similarly, the statistical analysis conducted on geographies consisting of 195,676,592 people shows a moderate positive correlation between the proportion of Immigrants from Hungary and percentage of households with 1 or more vehicles available in the United States with a correlation coefficient (R) of 0.426 and weighted average of 89.0%, a difference of 1.5%.
1 or more Vehicles in Household Correlation Summary
| Measurement | Immigrants from Syria | Immigrants from Hungary |
| Minimum | 81.7% | 86.3% |
| Maximum | 100.0% | 100.0% |
| Range | 18.3% | 13.7% |
| Mean | 92.9% | 94.9% |
| Median | 92.9% | 95.3% |
| Interquartile 25% (IQ1) | 90.9% | 91.7% |
| Interquartile 75% (IQ3) | 95.3% | 98.7% |
| Interquartile Range (IQR) | 4.4% | 7.0% |
| Standard Deviation (Sample) | 3.9% | 4.0% |
| Standard Deviation (Population) | 3.9% | 4.0% |
Similar Demographics by 1 or more Vehicles in Household
Demographics Similar to Immigrants from Syria by 1 or more Vehicles in Household
In terms of 1 or more vehicles in household, the demographic groups most similar to Immigrants from Syria are Immigrants from South Africa (90.4%, a difference of 0.020%), Kenyan (90.4%, a difference of 0.020%), Immigrants from Oceania (90.4%, a difference of 0.020%), Immigrants from Kenya (90.4%, a difference of 0.040%), and Hungarian (90.3%, a difference of 0.040%).
| Demographics | Rating | Rank | 1 or more Vehicles in Household |
| Immigrants | Cameroon | 89.4 /100 | #126 | Excellent 90.4% |
| Immigrants | Azores | 89.1 /100 | #127 | Excellent 90.4% |
| Burmese | 89.0 /100 | #128 | Excellent 90.4% |
| Marshallese | 88.9 /100 | #129 | Excellent 90.4% |
| Nicaraguans | 88.8 /100 | #130 | Excellent 90.4% |
| Immigrants | Kenya | 88.5 /100 | #131 | Excellent 90.4% |
| Immigrants | South Africa | 88.1 /100 | #132 | Excellent 90.4% |
| Immigrants | Syria | 87.5 /100 | #133 | Excellent 90.4% |
| Kenyans | 87.0 /100 | #134 | Excellent 90.4% |
| Immigrants | Oceania | 86.9 /100 | #135 | Excellent 90.4% |
| Hungarians | 86.5 /100 | #136 | Excellent 90.3% |
| Latvians | 86.3 /100 | #137 | Excellent 90.3% |
| Syrians | 86.3 /100 | #138 | Excellent 90.3% |
| Estonians | 85.6 /100 | #139 | Excellent 90.3% |
| Sudanese | 85.2 /100 | #140 | Excellent 90.3% |
Demographics Similar to Immigrants from Hungary by 1 or more Vehicles in Household
In terms of 1 or more vehicles in household, the demographic groups most similar to Immigrants from Hungary are Immigrants from Western Asia (89.0%, a difference of 0.010%), Somali (89.0%, a difference of 0.030%), Sierra Leonean (89.0%, a difference of 0.040%), Dutch West Indian (89.0%, a difference of 0.060%), and Immigrants from Italy (89.1%, a difference of 0.070%).
| Demographics | Rating | Rank | 1 or more Vehicles in Household |
| Immigrants | Denmark | 14.8 /100 | #207 | Poor 89.1% |
| Immigrants | Chile | 14.4 /100 | #208 | Poor 89.1% |
| Immigrants | Italy | 14.0 /100 | #209 | Poor 89.1% |
| Dutch West Indians | 13.5 /100 | #210 | Poor 89.0% |
| Sierra Leoneans | 13.0 /100 | #211 | Poor 89.0% |
| Somalis | 12.8 /100 | #212 | Poor 89.0% |
| Immigrants | Western Asia | 12.3 /100 | #213 | Poor 89.0% |
| Immigrants | Hungary | 11.9 /100 | #214 | Poor 89.0% |
| Immigrants | Sri Lanka | 10.2 /100 | #215 | Poor 88.9% |
| Immigrants | Argentina | 9.4 /100 | #216 | Tragic 88.9% |
| Argentineans | 8.8 /100 | #217 | Tragic 88.9% |
| Ugandans | 8.7 /100 | #218 | Tragic 88.9% |
| Immigrants | Guatemala | 8.6 /100 | #219 | Tragic 88.9% |
| Immigrants | Zaire | 8.1 /100 | #220 | Tragic 88.8% |
| Peruvians | 7.9 /100 | #221 | Tragic 88.8% |