Immigrants from Russia vs Immigrants from Ethiopia 1 or more Vehicles in Household
COMPARE
Immigrants from Russia
Immigrants from Ethiopia
1 or more Vehicles in Household
1 or more Vehicles in Household Comparison
Immigrants from Russia
Immigrants from Ethiopia
85.4%
1 OR MORE VEHICLES IN HOUSEHOLD
0.0/ 100
METRIC RATING
300th/ 347
METRIC RANK
89.6%
1 OR MORE VEHICLES IN HOUSEHOLD
42.5/ 100
METRIC RATING
181st/ 347
METRIC RANK
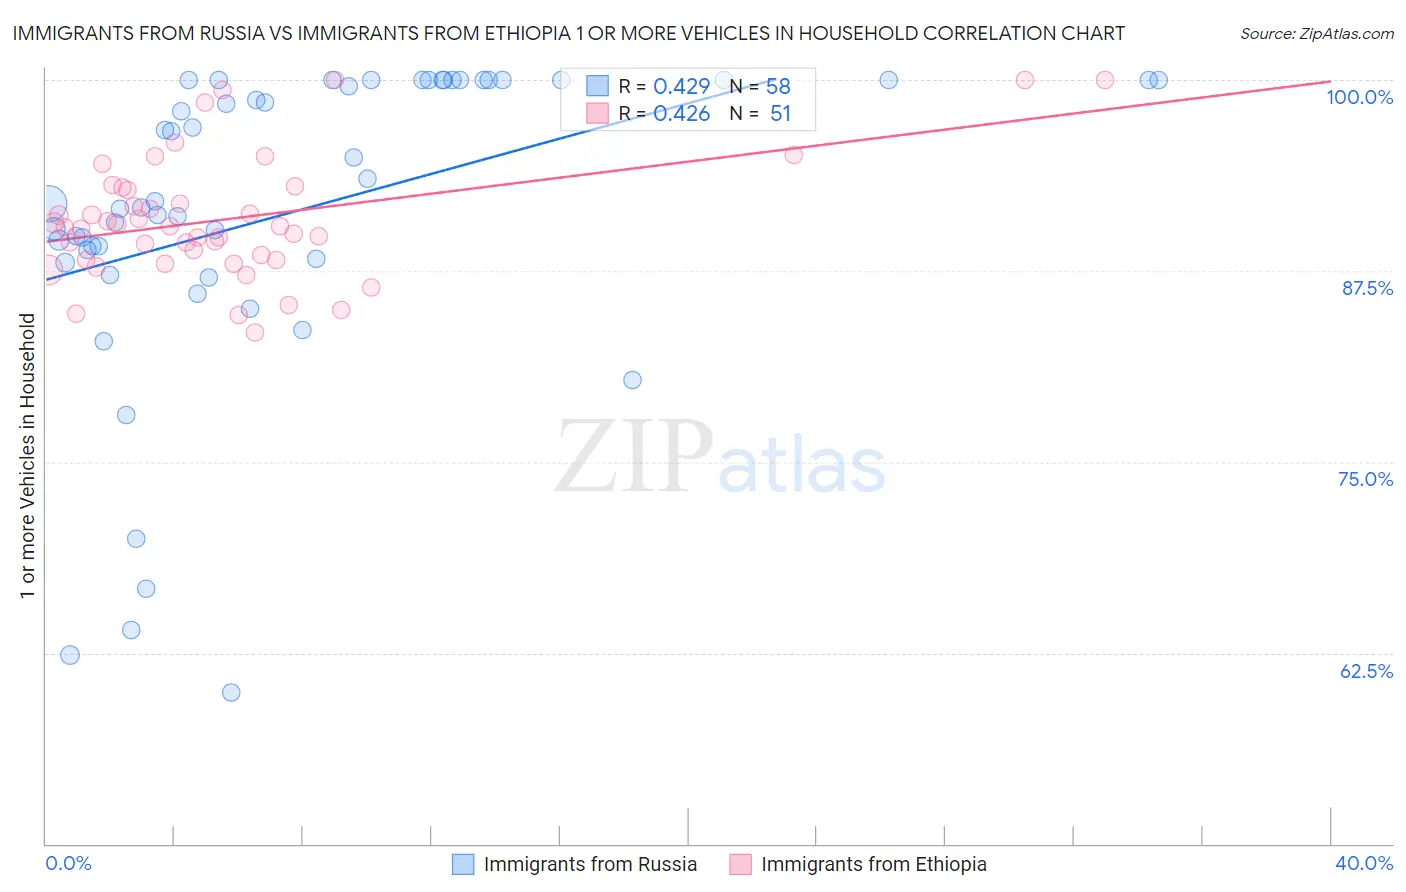
Immigrants from Russia vs Immigrants from Ethiopia 1 or more Vehicles in Household Correlation Chart
The statistical analysis conducted on geographies consisting of 347,625,185 people shows a moderate positive correlation between the proportion of Immigrants from Russia and percentage of households with 1 or more vehicles available in the United States with a correlation coefficient (R) of 0.429 and weighted average of 85.4%. Similarly, the statistical analysis conducted on geographies consisting of 211,422,561 people shows a moderate positive correlation between the proportion of Immigrants from Ethiopia and percentage of households with 1 or more vehicles available in the United States with a correlation coefficient (R) of 0.426 and weighted average of 89.6%, a difference of 4.8%.
1 or more Vehicles in Household Correlation Summary
| Measurement | Immigrants from Russia | Immigrants from Ethiopia |
| Minimum | 59.9% | 83.5% |
| Maximum | 100.0% | 100.0% |
| Range | 40.1% | 16.5% |
| Mean | 91.3% | 90.9% |
| Median | 92.0% | 90.4% |
| Interquartile 25% (IQ1) | 88.3% | 88.2% |
| Interquartile 75% (IQ3) | 100.0% | 92.9% |
| Interquartile Range (IQR) | 11.7% | 4.7% |
| Standard Deviation (Sample) | 10.2% | 4.0% |
| Standard Deviation (Population) | 10.1% | 4.0% |
Similar Demographics by 1 or more Vehicles in Household
Demographics Similar to Immigrants from Russia by 1 or more Vehicles in Household
In terms of 1 or more vehicles in household, the demographic groups most similar to Immigrants from Russia are Yuman (85.5%, a difference of 0.0%), Immigrants from Panama (85.4%, a difference of 0.040%), Moroccan (85.4%, a difference of 0.060%), Immigrants from Greece (85.4%, a difference of 0.090%), and Belizean (85.7%, a difference of 0.25%).
| Demographics | Rating | Rank | 1 or more Vehicles in Household |
| Indians (Asian) | 0.0 /100 | #293 | Tragic 86.0% |
| Alaskan Athabascans | 0.0 /100 | #294 | Tragic 86.0% |
| Immigrants | Jamaica | 0.0 /100 | #295 | Tragic 85.8% |
| Immigrants | Spain | 0.0 /100 | #296 | Tragic 85.8% |
| Paraguayans | 0.0 /100 | #297 | Tragic 85.7% |
| Belizeans | 0.0 /100 | #298 | Tragic 85.7% |
| Yuman | 0.0 /100 | #299 | Tragic 85.5% |
| Immigrants | Russia | 0.0 /100 | #300 | Tragic 85.4% |
| Immigrants | Panama | 0.0 /100 | #301 | Tragic 85.4% |
| Moroccans | 0.0 /100 | #302 | Tragic 85.4% |
| Immigrants | Greece | 0.0 /100 | #303 | Tragic 85.4% |
| Immigrants | Ukraine | 0.0 /100 | #304 | Tragic 85.2% |
| Immigrants | China | 0.0 /100 | #305 | Tragic 84.9% |
| Immigrants | Western Africa | 0.0 /100 | #306 | Tragic 84.9% |
| Tohono O'odham | 0.0 /100 | #307 | Tragic 84.7% |
Demographics Similar to Immigrants from Ethiopia by 1 or more Vehicles in Household
In terms of 1 or more vehicles in household, the demographic groups most similar to Immigrants from Ethiopia are Ukrainian (89.6%, a difference of 0.0%), Arab (89.6%, a difference of 0.010%), German Russian (89.6%, a difference of 0.020%), Ethiopian (89.6%, a difference of 0.020%), and Immigrants from El Salvador (89.6%, a difference of 0.030%).
| Demographics | Rating | Rank | 1 or more Vehicles in Household |
| Filipinos | 50.0 /100 | #174 | Average 89.7% |
| Immigrants | Burma/Myanmar | 47.6 /100 | #175 | Average 89.7% |
| Immigrants | Sudan | 47.1 /100 | #176 | Average 89.7% |
| Hmong | 45.8 /100 | #177 | Average 89.6% |
| Immigrants | El Salvador | 44.1 /100 | #178 | Average 89.6% |
| German Russians | 44.0 /100 | #179 | Average 89.6% |
| Arabs | 43.3 /100 | #180 | Average 89.6% |
| Immigrants | Ethiopia | 42.5 /100 | #181 | Average 89.6% |
| Ukrainians | 42.4 /100 | #182 | Average 89.6% |
| Ethiopians | 41.2 /100 | #183 | Average 89.6% |
| Immigrants | Bulgaria | 40.7 /100 | #184 | Average 89.6% |
| Immigrants | Brazil | 40.1 /100 | #185 | Average 89.6% |
| Pueblo | 39.9 /100 | #186 | Fair 89.6% |
| South Americans | 39.6 /100 | #187 | Fair 89.5% |
| Immigrants | Nepal | 38.9 /100 | #188 | Fair 89.5% |