Seminole vs Immigrants from Ethiopia 1 or more Vehicles in Household

COMPARE

Seminole
Race
Ancestry
AfghanAfricanAlaska NativeAlaskan AthabascanAlbanianAleutAlsatianAmericanApacheArabArapahoArgentineanArmenianAssyrian/Chaldean/SyriacAustralianAustrianBahamianBangladeshiBarbadianBasqueBelgianBelizeanBermudanBhutaneseBlackfeetBolivianBrazilianBritishBritish West IndianBulgarianBurmeseCajunCambodianCanadianCape VerdeanCarpatho RusynCelticCentral AmericanCentral American IndianCherokeeCheyenneChickasawChileanChineseChippewaChoctawColombianColvilleComancheCosta RicanCreeCreekCroatianCrowCubanCypriotCzechCzechoslovakianDanishDelawareDominicanDutchDutch West IndianEastern EuropeanEcuadorianEgyptianEnglishEstonianEthiopianEuropeanFijianFilipinoFinnishFrenchFrench American IndianFrench CanadianGermanGerman RussianGhanaianGreekGuamanian/ChamorroGuatemalanGuyaneseHaitianHmongHonduranHopiHoumaHungarianIcelanderIndian (Asian)IndonesianInupiatIranianIraqiIrishIroquoisIsraeliItalianJamaicanJapaneseJordanianKenyanKiowaKoreanLaotianLatvianLebaneseLiberianLithuanianLumbeeLuxembourgerMacedonianMalaysianMalteseMarshalleseMenomineeMexicanMexican American IndianMongolianMoroccanNative HawaiianNavajoNepaleseNew ZealanderNicaraguanNigerianNorthern EuropeanNorwegianOkinawanOsageOttawaPaiutePakistaniPalestinianPanamanianParaguayanPennsylvania GermanPeruvianPimaPolishPortuguesePotawatomiPuebloPuerto RicanPuget Sound SalishRomanianRussianSalvadoranSamoanScandinavianScotch-IrishScottishSeminoleSenegaleseSerbianShoshoneSierra LeoneanSiouxSlavicSlovakSloveneSomaliSouth AfricanSouth AmericanSouth American IndianSoviet UnionSpaniardSpanishSpanish AmericanSpanish American IndianSri LankanSubsaharan AfricanSudaneseSwedishSwissSyrianTaiwaneseThaiTlingit-HaidaTohono O'OdhamTonganTrinidadian and TobagonianTsimshianTurkishU.S. Virgin IslanderUgandanUkrainianUruguayanUteVenezuelanVietnameseWelshWest IndianYakamaYaquiYugoslavianYumanYup'ikZimbabwean
Immigration
NonimmigrantsImmigrantsAfghanistanAfricaAlbaniaArgentinaArmeniaAsiaAustraliaAustriaBahamasBangladeshBarbadosBelarusBelgiumBelizeBoliviaBosnia and HerzegovinaBrazilBulgariaBurma/MyanmarCabo VerdeCambodiaCameroonCanadaCaribbeanCentral AmericaChileChinaColombiaCongoCosta RicaCroatiaCubaCzechoslovakiaDenmarkDominicaDominican RepublicEastern AfricaEastern AsiaEastern EuropeEcuadorEgyptEl SalvadorEnglandEritreaEuropeFijiFranceGermanyGhanaGreeceGrenadaGuatemalaGuyanaHaitiHondurasHong KongHungaryIndiaIndonesiaIranIraqIrelandIsraelItalyJamaicaJapanJordanKazakhstanKenyaKoreaKuwaitLaosLatin AmericaLatviaLebanonLiberiaLithuaniaMalaysiaMexicoMicronesiaMiddle AfricaMoldovaMoroccoNepalNetherlandsNicaraguaNigeriaNorth AmericaNorth MacedoniaNorthern AfricaNorthern EuropeNorwayOceaniaPakistanPanamaPeruPhilippinesPolandPortugalRomaniaRussiaSaudi ArabiaScotlandSenegalSerbiaSierra LeoneSingaporeSomaliaSouth AfricaSouth AmericaSouth Central AsiaSouth Eastern AsiaSouthern EuropeSpainSri LankaSt. Vincent and the GrenadinesSudanSwedenSwitzerlandSyriaTaiwanThailandTrinidad and TobagoTurkeyUgandaUkraineUruguayUzbekistanVenezuelaVietnamWest IndiesWestern AfricaWestern AsiaWestern EuropeYemenZaireZimbabweAzores
Immigrants from Ethiopia
Race
Ancestry
AfghanAfricanAlaska NativeAlaskan AthabascanAlbanianAleutAlsatianAmericanApacheArabArapahoArgentineanArmenianAssyrian/Chaldean/SyriacAustralianAustrianBahamianBangladeshiBarbadianBasqueBelgianBelizeanBermudanBhutaneseBlackfeetBolivianBrazilianBritishBritish West IndianBulgarianBurmeseCajunCambodianCanadianCape VerdeanCarpatho RusynCelticCentral AmericanCentral American IndianCherokeeCheyenneChickasawChileanChineseChippewaChoctawColombianColvilleComancheCosta RicanCreeCreekCroatianCrowCubanCypriotCzechCzechoslovakianDanishDelawareDominicanDutchDutch West IndianEastern EuropeanEcuadorianEgyptianEnglishEstonianEthiopianEuropeanFijianFilipinoFinnishFrenchFrench American IndianFrench CanadianGermanGerman RussianGhanaianGreekGuamanian/ChamorroGuatemalanGuyaneseHaitianHmongHonduranHopiHoumaHungarianIcelanderIndian (Asian)IndonesianInupiatIranianIraqiIrishIroquoisIsraeliItalianJamaicanJapaneseJordanianKenyanKiowaKoreanLaotianLatvianLebaneseLiberianLithuanianLumbeeLuxembourgerMacedonianMalaysianMalteseMarshalleseMenomineeMexicanMexican American IndianMongolianMoroccanNative HawaiianNavajoNepaleseNew ZealanderNicaraguanNigerianNorthern EuropeanNorwegianOkinawanOsageOttawaPaiutePakistaniPalestinianPanamanianParaguayanPennsylvania GermanPeruvianPimaPolishPortuguesePotawatomiPuebloPuerto RicanPuget Sound SalishRomanianRussianSalvadoranSamoanScandinavianScotch-IrishScottishSenegaleseSerbianShoshoneSierra LeoneanSiouxSlavicSlovakSloveneSomaliSouth AfricanSouth AmericanSouth American IndianSoviet UnionSpaniardSpanishSpanish AmericanSpanish American IndianSri LankanSubsaharan AfricanSudaneseSwedishSwissSyrianTaiwaneseThaiTlingit-HaidaTohono O'OdhamTonganTrinidadian and TobagonianTsimshianTurkishU.S. Virgin IslanderUgandanUkrainianUruguayanUteVenezuelanVietnameseWelshWest IndianYakamaYaquiYugoslavianYumanYup'ikZimbabwean
Immigration
NonimmigrantsImmigrantsAfghanistanAfricaAlbaniaArgentinaArmeniaAsiaAustraliaAustriaBahamasBangladeshBarbadosBelarusBelgiumBelizeBoliviaBosnia and HerzegovinaBrazilBulgariaBurma/MyanmarCabo VerdeCambodiaCameroonCanadaCaribbeanCentral AmericaChileChinaColombiaCongoCosta RicaCroatiaCubaCzechoslovakiaDenmarkDominicaDominican RepublicEastern AfricaEastern AsiaEastern EuropeEcuadorEgyptEl SalvadorEnglandEritreaEthiopiaEuropeFijiFranceGermanyGhanaGreeceGrenadaGuatemalaGuyanaHaitiHondurasHong KongHungaryIndiaIndonesiaIranIraqIrelandIsraelItalyJamaicaJapanJordanKazakhstanKenyaKoreaKuwaitLaosLatin AmericaLatviaLebanonLiberiaLithuaniaMalaysiaMexicoMicronesiaMiddle AfricaMoldovaMoroccoNepalNetherlandsNicaraguaNigeriaNorth AmericaNorth MacedoniaNorthern AfricaNorthern EuropeNorwayOceaniaPakistanPanamaPeruPhilippinesPolandPortugalRomaniaRussiaSaudi ArabiaScotlandSenegalSerbiaSierra LeoneSingaporeSomaliaSouth AfricaSouth AmericaSouth Central AsiaSouth Eastern AsiaSouthern EuropeSpainSri LankaSt. Vincent and the GrenadinesSudanSwedenSwitzerlandSyriaTaiwanThailandTrinidad and TobagoTurkeyUgandaUkraineUruguayUzbekistanVenezuelaVietnamWest IndiesWestern AfricaWestern AsiaWestern EuropeYemenZaireZimbabweAzores
1 or more Vehicles in Household
Income
Poverty
Unemployment
Labor Participation
Family Structure
Vehicle Availability
Education Level
Disability

1 or more Vehicles in Household Comparison

Seminole

Immigrants from Ethiopia

Exceptional
Average
91.1%
1 OR MORE VEHICLES IN HOUSEHOLD
98.3/ 100
METRIC RATING
102nd/ 347
METRIC RANK
89.6%
1 OR MORE VEHICLES IN HOUSEHOLD
42.5/ 100
METRIC RATING
181st/ 347
METRIC RANK

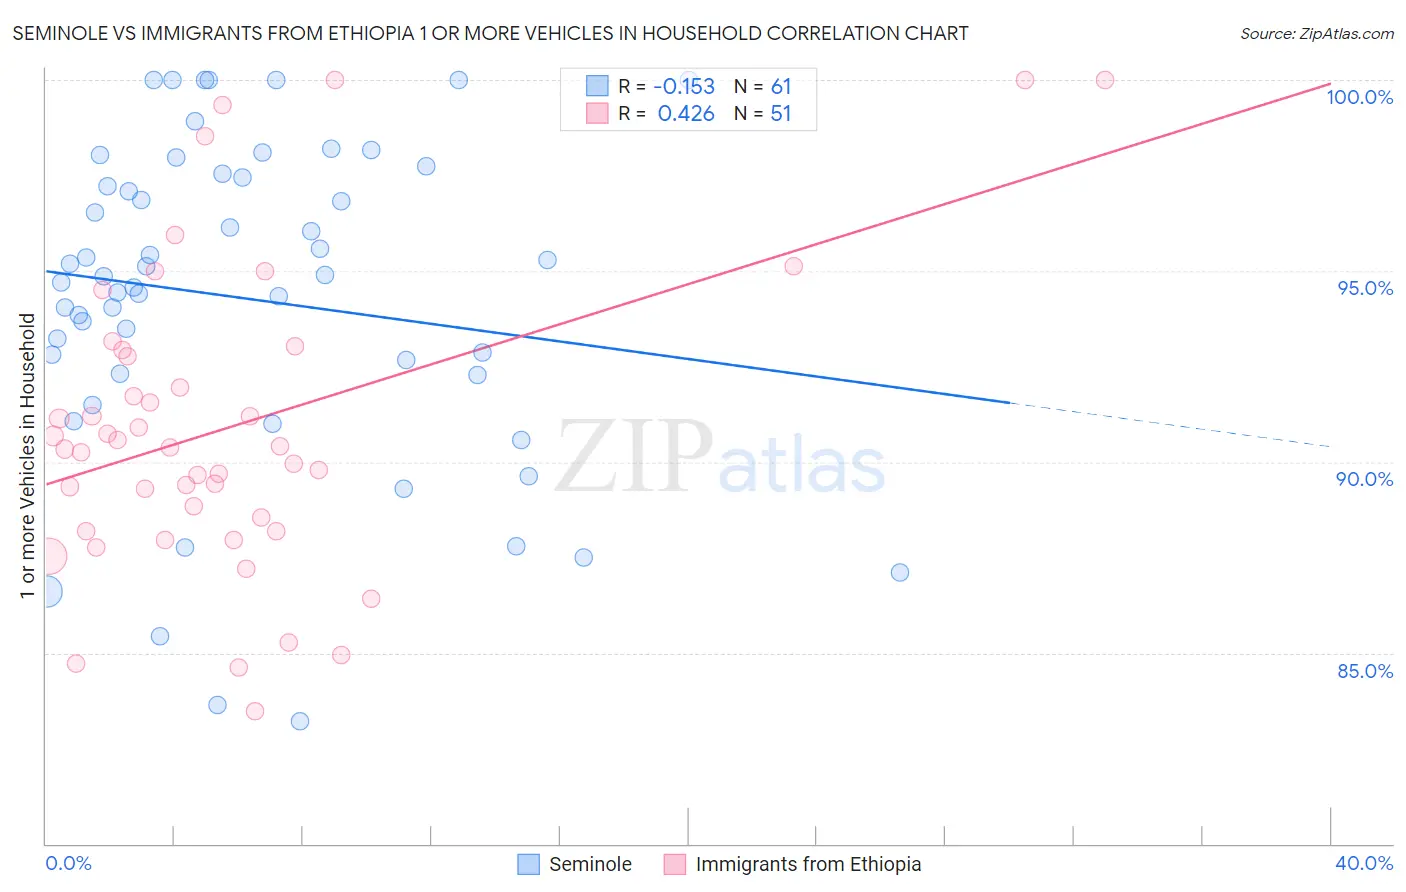
Seminole vs Immigrants from Ethiopia 1 or more Vehicles in Household Correlation Chart

The statistical analysis conducted on geographies consisting of 118,307,122 people shows a poor negative correlation between the proportion of Seminole and percentage of households with 1 or more vehicles available in the United States with a correlation coefficient (R) of -0.153 and weighted average of 91.1%. Similarly, the statistical analysis conducted on geographies consisting of 211,422,561 people shows a moderate positive correlation between the proportion of Immigrants from Ethiopia and percentage of households with 1 or more vehicles available in the United States with a correlation coefficient (R) of 0.426 and weighted average of 89.6%, a difference of 1.7%.
Seminole vs Immigrants from Ethiopia 1 or more Vehicles in Household

1 or more Vehicles in Household Correlation Summary

MeasurementSeminoleImmigrants from Ethiopia
Minimum83.2%83.5%
Maximum100.0%100.0%
Range16.8%16.5%
Mean94.3%90.9%
Median94.8%90.4%
Interquartile 25% (IQ1)92.3%88.2%
Interquartile 75% (IQ3)97.5%92.9%
Interquartile Range (IQR)5.2%4.7%
Standard Deviation (Sample)4.2%4.0%
Standard Deviation (Population)4.2%4.0%

Similar Demographics by 1 or more Vehicles in Household

Demographics Similar to Seminole by 1 or more Vehicles in Household

In terms of 1 or more vehicles in household, the demographic groups most similar to Seminole are Yugoslavian (91.1%, a difference of 0.010%), Bulgarian (91.1%, a difference of 0.020%), Asian (91.1%, a difference of 0.020%), Immigrants from Central America (91.1%, a difference of 0.030%), and Immigrants from Bolivia (91.2%, a difference of 0.070%).
DemographicsRating | Rank1 or more Vehicles in Household
Austrians
99.0
/100
|
#95
Exceptional
91.3%
Potawatomi
99.0
/100
|
#96
Exceptional
91.3%
Pakistanis
99.0
/100
|
#97
Exceptional
91.3%
Slavs
98.7
/100
|
#98
Exceptional
91.2%
Immigrants | Bolivia
98.6
/100
|
#99
Exceptional
91.2%
Immigrants | Central America
98.4
/100
|
#100
Exceptional
91.1%
Bulgarians
98.4
/100
|
#101
Exceptional
91.1%
Seminole
98.3
/100
|
#102
Exceptional
91.1%
Yugoslavians
98.3
/100
|
#103
Exceptional
91.1%
Asians
98.2
/100
|
#104
Exceptional
91.1%
Laotians
98.0
/100
|
#105
Exceptional
91.0%
Zimbabweans
97.7
/100
|
#106
Exceptional
91.0%
Maltese
97.7
/100
|
#107
Exceptional
91.0%
Hispanics or Latinos
97.6
/100
|
#108
Exceptional
91.0%
Delaware
97.6
/100
|
#109
Exceptional
91.0%

Demographics Similar to Immigrants from Ethiopia by 1 or more Vehicles in Household

In terms of 1 or more vehicles in household, the demographic groups most similar to Immigrants from Ethiopia are Ukrainian (89.6%, a difference of 0.0%), Arab (89.6%, a difference of 0.010%), German Russian (89.6%, a difference of 0.020%), Ethiopian (89.6%, a difference of 0.020%), and Immigrants from El Salvador (89.6%, a difference of 0.030%).
DemographicsRating | Rank1 or more Vehicles in Household
Filipinos
50.0
/100
|
#174
Average
89.7%
Immigrants | Burma/Myanmar
47.6
/100
|
#175
Average
89.7%
Immigrants | Sudan
47.1
/100
|
#176
Average
89.7%
Hmong
45.8
/100
|
#177
Average
89.6%
Immigrants | El Salvador
44.1
/100
|
#178
Average
89.6%
German Russians
44.0
/100
|
#179
Average
89.6%
Arabs
43.3
/100
|
#180
Average
89.6%
Immigrants | Ethiopia
42.5
/100
|
#181
Average
89.6%
Ukrainians
42.4
/100
|
#182
Average
89.6%
Ethiopians
41.2
/100
|
#183
Average
89.6%
Immigrants | Bulgaria
40.7
/100
|
#184
Average
89.6%
Immigrants | Brazil
40.1
/100
|
#185
Average
89.6%
Pueblo
39.9
/100
|
#186
Fair
89.6%
South Americans
39.6
/100
|
#187
Fair
89.5%
Immigrants | Nepal
38.9
/100
|
#188
Fair
89.5%