Immigrants from St. Vincent and the Grenadines vs Immigrants from Ethiopia 1 or more Vehicles in Household
COMPARE
Immigrants from St. Vincent and the Grenadines
Immigrants from Ethiopia
1 or more Vehicles in Household
1 or more Vehicles in Household Comparison
Immigrants from St. Vincent and the Grenadines
Immigrants from Ethiopia
64.7%
1 OR MORE VEHICLES IN HOUSEHOLD
0.0/ 100
METRIC RATING
345th/ 347
METRIC RANK
89.6%
1 OR MORE VEHICLES IN HOUSEHOLD
42.5/ 100
METRIC RATING
181st/ 347
METRIC RANK
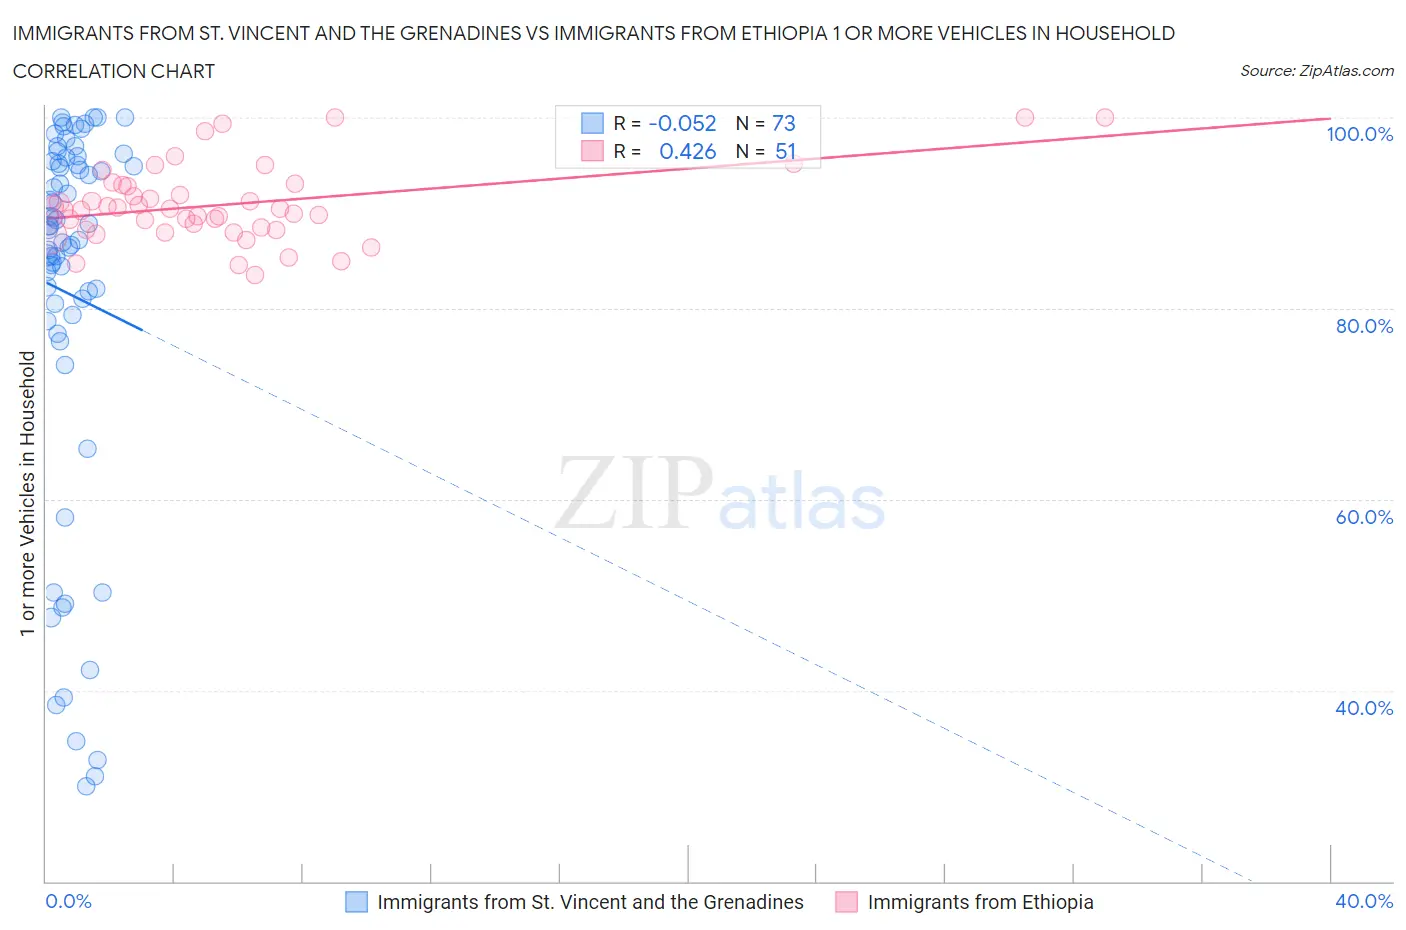
Immigrants from St. Vincent and the Grenadines vs Immigrants from Ethiopia 1 or more Vehicles in Household Correlation Chart
The statistical analysis conducted on geographies consisting of 56,188,620 people shows a slight negative correlation between the proportion of Immigrants from St. Vincent and the Grenadines and percentage of households with 1 or more vehicles available in the United States with a correlation coefficient (R) of -0.052 and weighted average of 64.7%. Similarly, the statistical analysis conducted on geographies consisting of 211,422,561 people shows a moderate positive correlation between the proportion of Immigrants from Ethiopia and percentage of households with 1 or more vehicles available in the United States with a correlation coefficient (R) of 0.426 and weighted average of 89.6%, a difference of 38.5%.
1 or more Vehicles in Household Correlation Summary
| Measurement | Immigrants from St. Vincent and the Grenadines | Immigrants from Ethiopia |
| Minimum | 30.0% | 83.5% |
| Maximum | 100.0% | 100.0% |
| Range | 70.0% | 16.5% |
| Mean | 81.5% | 90.9% |
| Median | 88.2% | 90.4% |
| Interquartile 25% (IQ1) | 79.0% | 88.2% |
| Interquartile 75% (IQ3) | 95.2% | 92.9% |
| Interquartile Range (IQR) | 16.2% | 4.7% |
| Standard Deviation (Sample) | 19.9% | 4.0% |
| Standard Deviation (Population) | 19.8% | 4.0% |
Similar Demographics by 1 or more Vehicles in Household
Demographics Similar to Immigrants from St. Vincent and the Grenadines by 1 or more Vehicles in Household
In terms of 1 or more vehicles in household, the demographic groups most similar to Immigrants from St. Vincent and the Grenadines are Immigrants from Grenada (62.7%, a difference of 3.2%), Immigrants from Dominican Republic (68.6%, a difference of 6.1%), British West Indian (70.4%, a difference of 8.8%), Immigrants from Guyana (70.6%, a difference of 9.1%), and Immigrants from Barbados (70.6%, a difference of 9.1%).
| Demographics | Rating | Rank | 1 or more Vehicles in Household |
| Immigrants | Ecuador | 0.0 /100 | #333 | Tragic 76.2% |
| Immigrants | Bangladesh | 0.0 /100 | #334 | Tragic 74.3% |
| Barbadians | 0.0 /100 | #335 | Tragic 74.0% |
| Vietnamese | 0.0 /100 | #336 | Tragic 73.8% |
| Immigrants | Uzbekistan | 0.0 /100 | #337 | Tragic 73.4% |
| Inupiat | 0.0 /100 | #338 | Tragic 71.5% |
| Guyanese | 0.0 /100 | #339 | Tragic 70.8% |
| Dominicans | 0.0 /100 | #340 | Tragic 70.7% |
| Immigrants | Barbados | 0.0 /100 | #341 | Tragic 70.6% |
| Immigrants | Guyana | 0.0 /100 | #342 | Tragic 70.6% |
| British West Indians | 0.0 /100 | #343 | Tragic 70.4% |
| Immigrants | Dominican Republic | 0.0 /100 | #344 | Tragic 68.6% |
| Immigrants | St. Vincent and the Grenadines | 0.0 /100 | #345 | Tragic 64.7% |
| Immigrants | Grenada | 0.0 /100 | #346 | Tragic 62.7% |
| Yup'ik | 0.0 /100 | #347 | Tragic 58.4% |
Demographics Similar to Immigrants from Ethiopia by 1 or more Vehicles in Household
In terms of 1 or more vehicles in household, the demographic groups most similar to Immigrants from Ethiopia are Ukrainian (89.6%, a difference of 0.0%), Arab (89.6%, a difference of 0.010%), German Russian (89.6%, a difference of 0.020%), Ethiopian (89.6%, a difference of 0.020%), and Immigrants from El Salvador (89.6%, a difference of 0.030%).
| Demographics | Rating | Rank | 1 or more Vehicles in Household |
| Filipinos | 50.0 /100 | #174 | Average 89.7% |
| Immigrants | Burma/Myanmar | 47.6 /100 | #175 | Average 89.7% |
| Immigrants | Sudan | 47.1 /100 | #176 | Average 89.7% |
| Hmong | 45.8 /100 | #177 | Average 89.6% |
| Immigrants | El Salvador | 44.1 /100 | #178 | Average 89.6% |
| German Russians | 44.0 /100 | #179 | Average 89.6% |
| Arabs | 43.3 /100 | #180 | Average 89.6% |
| Immigrants | Ethiopia | 42.5 /100 | #181 | Average 89.6% |
| Ukrainians | 42.4 /100 | #182 | Average 89.6% |
| Ethiopians | 41.2 /100 | #183 | Average 89.6% |
| Immigrants | Bulgaria | 40.7 /100 | #184 | Average 89.6% |
| Immigrants | Brazil | 40.1 /100 | #185 | Average 89.6% |
| Pueblo | 39.9 /100 | #186 | Fair 89.6% |
| South Americans | 39.6 /100 | #187 | Fair 89.5% |
| Immigrants | Nepal | 38.9 /100 | #188 | Fair 89.5% |