Immigrants from Denmark vs Cape Verdean 2 or more Vehicles in Household
COMPARE
Immigrants from Denmark
Cape Verdean
2 or more Vehicles in Household
2 or more Vehicles in Household Comparison
Immigrants from Denmark
Cape Verdeans
55.3%
2 OR MORE VEHICLES IN HOUSEHOLD
49.4/ 100
METRIC RATING
175th/ 347
METRIC RANK
46.8%
2 OR MORE VEHICLES IN HOUSEHOLD
0.0/ 100
METRIC RATING
316th/ 347
METRIC RANK
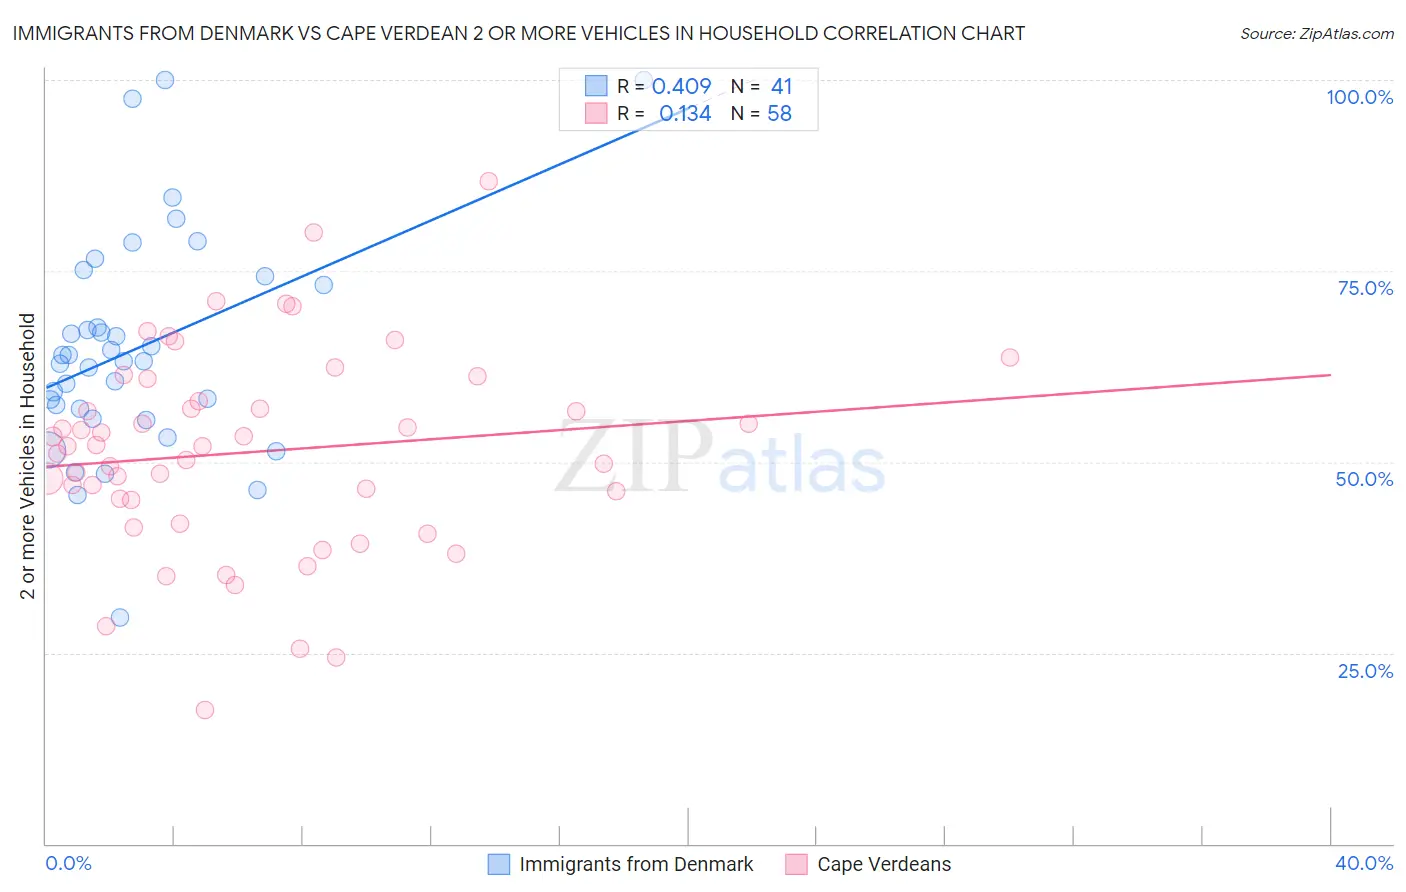
Immigrants from Denmark vs Cape Verdean 2 or more Vehicles in Household Correlation Chart
The statistical analysis conducted on geographies consisting of 136,403,254 people shows a moderate positive correlation between the proportion of Immigrants from Denmark and percentage of households with 2 or more vehicles available in the United States with a correlation coefficient (R) of 0.409 and weighted average of 55.3%. Similarly, the statistical analysis conducted on geographies consisting of 107,560,246 people shows a poor positive correlation between the proportion of Cape Verdeans and percentage of households with 2 or more vehicles available in the United States with a correlation coefficient (R) of 0.134 and weighted average of 46.8%, a difference of 18.3%.
2 or more Vehicles in Household Correlation Summary
| Measurement | Immigrants from Denmark | Cape Verdean |
| Minimum | 29.6% | 17.5% |
| Maximum | 100.0% | 86.7% |
| Range | 70.4% | 69.1% |
| Mean | 64.9% | 51.3% |
| Median | 63.2% | 52.1% |
| Interquartile 25% (IQ1) | 56.3% | 45.1% |
| Interquartile 75% (IQ3) | 73.8% | 58.0% |
| Interquartile Range (IQR) | 17.5% | 12.9% |
| Standard Deviation (Sample) | 14.6% | 13.3% |
| Standard Deviation (Population) | 14.4% | 13.1% |
Similar Demographics by 2 or more Vehicles in Household
Demographics Similar to Immigrants from Denmark by 2 or more Vehicles in Household
In terms of 2 or more vehicles in household, the demographic groups most similar to Immigrants from Denmark are Navajo (55.3%, a difference of 0.020%), Immigrants from Western Europe (55.4%, a difference of 0.080%), Immigrants from Nicaragua (55.4%, a difference of 0.090%), Immigrants from Cuba (55.3%, a difference of 0.090%), and Menominee (55.3%, a difference of 0.13%).
| Demographics | Rating | Rank | 2 or more Vehicles in Household |
| French American Indians | 56.7 /100 | #168 | Average 55.5% |
| Immigrants | Austria | 56.3 /100 | #169 | Average 55.5% |
| Romanians | 55.8 /100 | #170 | Average 55.5% |
| Immigrants | Costa Rica | 54.4 /100 | #171 | Average 55.4% |
| Immigrants | Nicaragua | 51.6 /100 | #172 | Average 55.4% |
| Immigrants | Western Europe | 51.4 /100 | #173 | Average 55.4% |
| Navajo | 50.0 /100 | #174 | Average 55.3% |
| Immigrants | Denmark | 49.4 /100 | #175 | Average 55.3% |
| Immigrants | Cuba | 47.0 /100 | #176 | Average 55.3% |
| Menominee | 46.2 /100 | #177 | Average 55.3% |
| Immigrants | Sweden | 45.3 /100 | #178 | Average 55.2% |
| Alaskan Athabascans | 42.9 /100 | #179 | Average 55.2% |
| Immigrants | Kenya | 40.4 /100 | #180 | Average 55.1% |
| Immigrants | Micronesia | 38.2 /100 | #181 | Fair 55.1% |
| Cree | 38.2 /100 | #182 | Fair 55.1% |
Demographics Similar to Cape Verdeans by 2 or more Vehicles in Household
In terms of 2 or more vehicles in household, the demographic groups most similar to Cape Verdeans are Immigrants from Haiti (46.5%, a difference of 0.53%), Puerto Rican (47.1%, a difference of 0.69%), Immigrants from Ghana (47.4%, a difference of 1.3%), U.S. Virgin Islander (47.5%, a difference of 1.5%), and Haitian (47.6%, a difference of 1.7%).
| Demographics | Rating | Rank | 2 or more Vehicles in Household |
| Moroccans | 0.0 /100 | #309 | Tragic 48.8% |
| Ghanaians | 0.0 /100 | #310 | Tragic 48.0% |
| Immigrants | Belarus | 0.0 /100 | #311 | Tragic 47.9% |
| Haitians | 0.0 /100 | #312 | Tragic 47.6% |
| U.S. Virgin Islanders | 0.0 /100 | #313 | Tragic 47.5% |
| Immigrants | Ghana | 0.0 /100 | #314 | Tragic 47.4% |
| Puerto Ricans | 0.0 /100 | #315 | Tragic 47.1% |
| Cape Verdeans | 0.0 /100 | #316 | Tragic 46.8% |
| Immigrants | Haiti | 0.0 /100 | #317 | Tragic 46.5% |
| Immigrants | Albania | 0.0 /100 | #318 | Tragic 46.0% |
| Jamaicans | 0.0 /100 | #319 | Tragic 45.8% |
| Soviet Union | 0.0 /100 | #320 | Tragic 45.7% |
| Immigrants | Jamaica | 0.0 /100 | #321 | Tragic 44.5% |
| Senegalese | 0.0 /100 | #322 | Tragic 44.2% |
| Immigrants | Caribbean | 0.0 /100 | #323 | Tragic 44.2% |