Immigrants from Switzerland vs Cape Verdean Unemployment Among Youth under 25 years
COMPARE
Immigrants from Switzerland
Cape Verdean
Unemployment Among Youth under 25 years
Unemployment Among Youth under 25 years Comparison
Immigrants from Switzerland
Cape Verdeans
11.5%
UNEMPLOYMENT AMONG YOUTH UNDER 25 YEARS
71.6/ 100
METRIC RATING
150th/ 347
METRIC RANK
12.9%
UNEMPLOYMENT AMONG YOUTH UNDER 25 YEARS
0.0/ 100
METRIC RATING
272nd/ 347
METRIC RANK
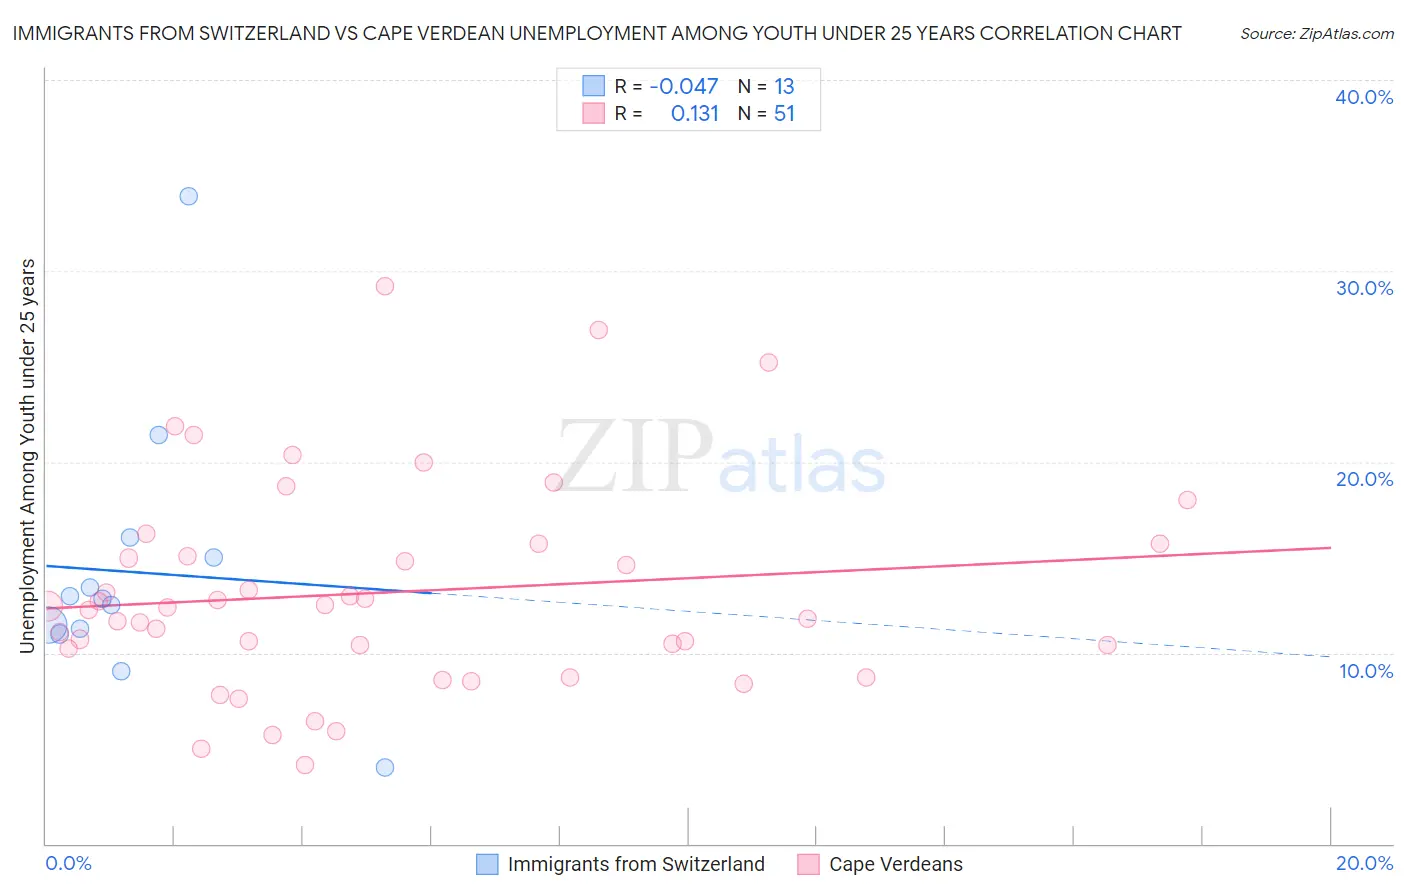
Immigrants from Switzerland vs Cape Verdean Unemployment Among Youth under 25 years Correlation Chart
The statistical analysis conducted on geographies consisting of 147,127,342 people shows no correlation between the proportion of Immigrants from Switzerland and unemployment rate among youth under the age of 25 in the United States with a correlation coefficient (R) of -0.047 and weighted average of 11.5%. Similarly, the statistical analysis conducted on geographies consisting of 107,205,825 people shows a poor positive correlation between the proportion of Cape Verdeans and unemployment rate among youth under the age of 25 in the United States with a correlation coefficient (R) of 0.131 and weighted average of 12.9%, a difference of 12.3%.
Unemployment Among Youth under 25 years Correlation Summary
| Measurement | Immigrants from Switzerland | Cape Verdean |
| Minimum | 4.0% | 4.1% |
| Maximum | 33.9% | 29.2% |
| Range | 29.9% | 25.1% |
| Mean | 14.2% | 13.2% |
| Median | 12.9% | 12.4% |
| Interquartile 25% (IQ1) | 11.1% | 10.2% |
| Interquartile 75% (IQ3) | 15.5% | 15.7% |
| Interquartile Range (IQR) | 4.4% | 5.5% |
| Standard Deviation (Sample) | 7.1% | 5.5% |
| Standard Deviation (Population) | 6.8% | 5.4% |
Similar Demographics by Unemployment Among Youth under 25 years
Demographics Similar to Immigrants from Switzerland by Unemployment Among Youth under 25 years
In terms of unemployment among youth under 25 years, the demographic groups most similar to Immigrants from Switzerland are Immigrants from Cambodia (11.5%, a difference of 0.010%), Immigrants from Northern Europe (11.5%, a difference of 0.020%), Laotian (11.5%, a difference of 0.040%), Brazilian (11.5%, a difference of 0.050%), and Uruguayan (11.5%, a difference of 0.060%).
| Demographics | Rating | Rank | Unemployment Among Youth under 25 years |
| Immigrants | Uganda | 74.5 /100 | #143 | Good 11.5% |
| Immigrants | Brazil | 74.3 /100 | #144 | Good 11.5% |
| Argentineans | 73.0 /100 | #145 | Good 11.5% |
| Brazilians | 72.5 /100 | #146 | Good 11.5% |
| Laotians | 72.4 /100 | #147 | Good 11.5% |
| Immigrants | Northern Europe | 72.1 /100 | #148 | Good 11.5% |
| Immigrants | Cambodia | 71.8 /100 | #149 | Good 11.5% |
| Immigrants | Switzerland | 71.6 /100 | #150 | Good 11.5% |
| Uruguayans | 70.4 /100 | #151 | Good 11.5% |
| Iraqis | 68.3 /100 | #152 | Good 11.5% |
| Immigrants | Czechoslovakia | 67.1 /100 | #153 | Good 11.5% |
| Immigrants | Asia | 66.7 /100 | #154 | Good 11.5% |
| Immigrants | Romania | 66.3 /100 | #155 | Good 11.5% |
| Immigrants | Germany | 65.9 /100 | #156 | Good 11.5% |
| Indians (Asian) | 65.1 /100 | #157 | Good 11.5% |
Demographics Similar to Cape Verdeans by Unemployment Among Youth under 25 years
In terms of unemployment among youth under 25 years, the demographic groups most similar to Cape Verdeans are Immigrants from Bahamas (12.9%, a difference of 0.22%), Nigerian (13.0%, a difference of 0.35%), Immigrants from Liberia (12.8%, a difference of 0.75%), Immigrants from Nigeria (13.0%, a difference of 0.93%), and Bermudan (13.0%, a difference of 1.0%).
| Demographics | Rating | Rank | Unemployment Among Youth under 25 years |
| Nepalese | 0.0 /100 | #265 | Tragic 12.5% |
| Immigrants | Latin America | 0.0 /100 | #266 | Tragic 12.6% |
| Sub-Saharan Africans | 0.0 /100 | #267 | Tragic 12.6% |
| Tlingit-Haida | 0.0 /100 | #268 | Tragic 12.7% |
| Kiowa | 0.0 /100 | #269 | Tragic 12.7% |
| Immigrants | Liberia | 0.0 /100 | #270 | Tragic 12.8% |
| Immigrants | Bahamas | 0.0 /100 | #271 | Tragic 12.9% |
| Cape Verdeans | 0.0 /100 | #272 | Tragic 12.9% |
| Nigerians | 0.0 /100 | #273 | Tragic 13.0% |
| Immigrants | Nigeria | 0.0 /100 | #274 | Tragic 13.0% |
| Bermudans | 0.0 /100 | #275 | Tragic 13.0% |
| Immigrants | Uzbekistan | 0.0 /100 | #276 | Tragic 13.1% |
| Bahamians | 0.0 /100 | #277 | Tragic 13.1% |
| Africans | 0.0 /100 | #278 | Tragic 13.2% |
| Cajuns | 0.0 /100 | #279 | Tragic 13.2% |