Immigrants from Sudan vs Spanish American 3 or more Vehicles in Household
COMPARE
Immigrants from Sudan
Spanish American
3 or more Vehicles in Household
3 or more Vehicles in Household Comparison
Immigrants from Sudan
Spanish Americans
17.6%
3 OR MORE VEHICLES IN HOUSEHOLD
0.5/ 100
METRIC RATING
273rd/ 347
METRIC RANK
23.0%
3 OR MORE VEHICLES IN HOUSEHOLD
100.0/ 100
METRIC RATING
33rd/ 347
METRIC RANK
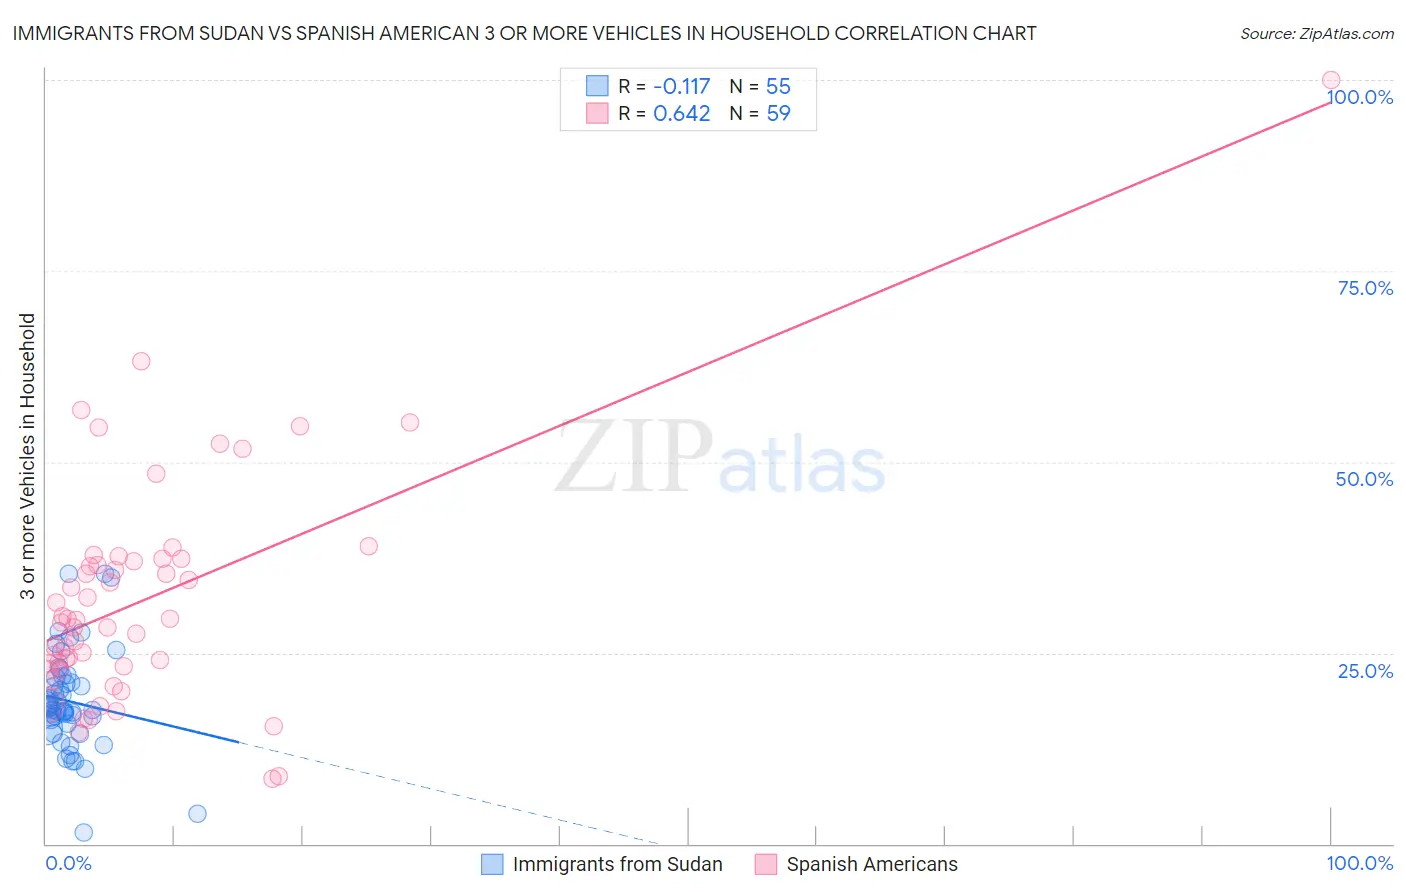
Immigrants from Sudan vs Spanish American 3 or more Vehicles in Household Correlation Chart
The statistical analysis conducted on geographies consisting of 118,948,382 people shows a poor negative correlation between the proportion of Immigrants from Sudan and percentage of households with 3 or more vehicles available in the United States with a correlation coefficient (R) of -0.117 and weighted average of 17.6%. Similarly, the statistical analysis conducted on geographies consisting of 103,168,496 people shows a significant positive correlation between the proportion of Spanish Americans and percentage of households with 3 or more vehicles available in the United States with a correlation coefficient (R) of 0.642 and weighted average of 23.0%, a difference of 31.1%.
3 or more Vehicles in Household Correlation Summary
| Measurement | Immigrants from Sudan | Spanish American |
| Minimum | 1.5% | 8.5% |
| Maximum | 35.4% | 100.0% |
| Range | 33.8% | 91.5% |
| Mean | 18.6% | 32.0% |
| Median | 17.6% | 29.3% |
| Interquartile 25% (IQ1) | 15.6% | 23.3% |
| Interquartile 75% (IQ3) | 21.8% | 37.2% |
| Interquartile Range (IQR) | 6.2% | 13.9% |
| Standard Deviation (Sample) | 6.5% | 15.1% |
| Standard Deviation (Population) | 6.5% | 14.9% |
Similar Demographics by 3 or more Vehicles in Household
Demographics Similar to Immigrants from Sudan by 3 or more Vehicles in Household
In terms of 3 or more vehicles in household, the demographic groups most similar to Immigrants from Sudan are Immigrants from Africa (17.6%, a difference of 0.040%), Immigrants from Bosnia and Herzegovina (17.5%, a difference of 0.15%), Immigrants from Ukraine (17.5%, a difference of 0.44%), Immigrants from Nepal (17.6%, a difference of 0.45%), and South American (17.6%, a difference of 0.45%).
| Demographics | Rating | Rank | 3 or more Vehicles in Household |
| Macedonians | 0.8 /100 | #266 | Tragic 17.7% |
| Immigrants | Venezuela | 0.8 /100 | #267 | Tragic 17.7% |
| Immigrants | Bulgaria | 0.8 /100 | #268 | Tragic 17.7% |
| Immigrants | France | 0.6 /100 | #269 | Tragic 17.6% |
| Immigrants | Nepal | 0.6 /100 | #270 | Tragic 17.6% |
| South Americans | 0.6 /100 | #271 | Tragic 17.6% |
| Immigrants | Africa | 0.5 /100 | #272 | Tragic 17.6% |
| Immigrants | Sudan | 0.5 /100 | #273 | Tragic 17.6% |
| Immigrants | Bosnia and Herzegovina | 0.5 /100 | #274 | Tragic 17.5% |
| Immigrants | Ukraine | 0.4 /100 | #275 | Tragic 17.5% |
| Okinawans | 0.4 /100 | #276 | Tragic 17.4% |
| Brazilians | 0.4 /100 | #277 | Tragic 17.4% |
| Immigrants | Bahamas | 0.3 /100 | #278 | Tragic 17.4% |
| Immigrants | Kazakhstan | 0.3 /100 | #279 | Tragic 17.4% |
| Immigrants | Eastern Europe | 0.3 /100 | #280 | Tragic 17.4% |
Demographics Similar to Spanish Americans by 3 or more Vehicles in Household
In terms of 3 or more vehicles in household, the demographic groups most similar to Spanish Americans are Swiss (23.0%, a difference of 0.050%), Pueblo (23.0%, a difference of 0.060%), Choctaw (23.0%, a difference of 0.070%), Cherokee (23.0%, a difference of 0.11%), and Swedish (23.0%, a difference of 0.14%).
| Demographics | Rating | Rank | 3 or more Vehicles in Household |
| Mexican American Indians | 100.0 /100 | #26 | Exceptional 23.3% |
| Guamanians/Chamorros | 100.0 /100 | #27 | Exceptional 23.2% |
| Lumbee | 100.0 /100 | #28 | Exceptional 23.1% |
| Spanish | 100.0 /100 | #29 | Exceptional 23.1% |
| Immigrants | South Eastern Asia | 100.0 /100 | #30 | Exceptional 23.1% |
| English | 100.0 /100 | #31 | Exceptional 23.1% |
| Pueblo | 100.0 /100 | #32 | Exceptional 23.0% |
| Spanish Americans | 100.0 /100 | #33 | Exceptional 23.0% |
| Swiss | 100.0 /100 | #34 | Exceptional 23.0% |
| Choctaw | 100.0 /100 | #35 | Exceptional 23.0% |
| Cherokee | 100.0 /100 | #36 | Exceptional 23.0% |
| Swedes | 100.0 /100 | #37 | Exceptional 23.0% |
| Dutch | 100.0 /100 | #38 | Exceptional 22.9% |
| Yaqui | 100.0 /100 | #39 | Exceptional 22.9% |
| Europeans | 100.0 /100 | #40 | Exceptional 22.9% |