Immigrants from Sudan vs Immigrants from West Indies 3 or more Vehicles in Household
COMPARE
Immigrants from Sudan
Immigrants from West Indies
3 or more Vehicles in Household
3 or more Vehicles in Household Comparison
Immigrants from Sudan
Immigrants from West Indies
17.6%
3 OR MORE VEHICLES IN HOUSEHOLD
0.5/ 100
METRIC RATING
273rd/ 347
METRIC RANK
14.6%
3 OR MORE VEHICLES IN HOUSEHOLD
0.0/ 100
METRIC RATING
322nd/ 347
METRIC RANK
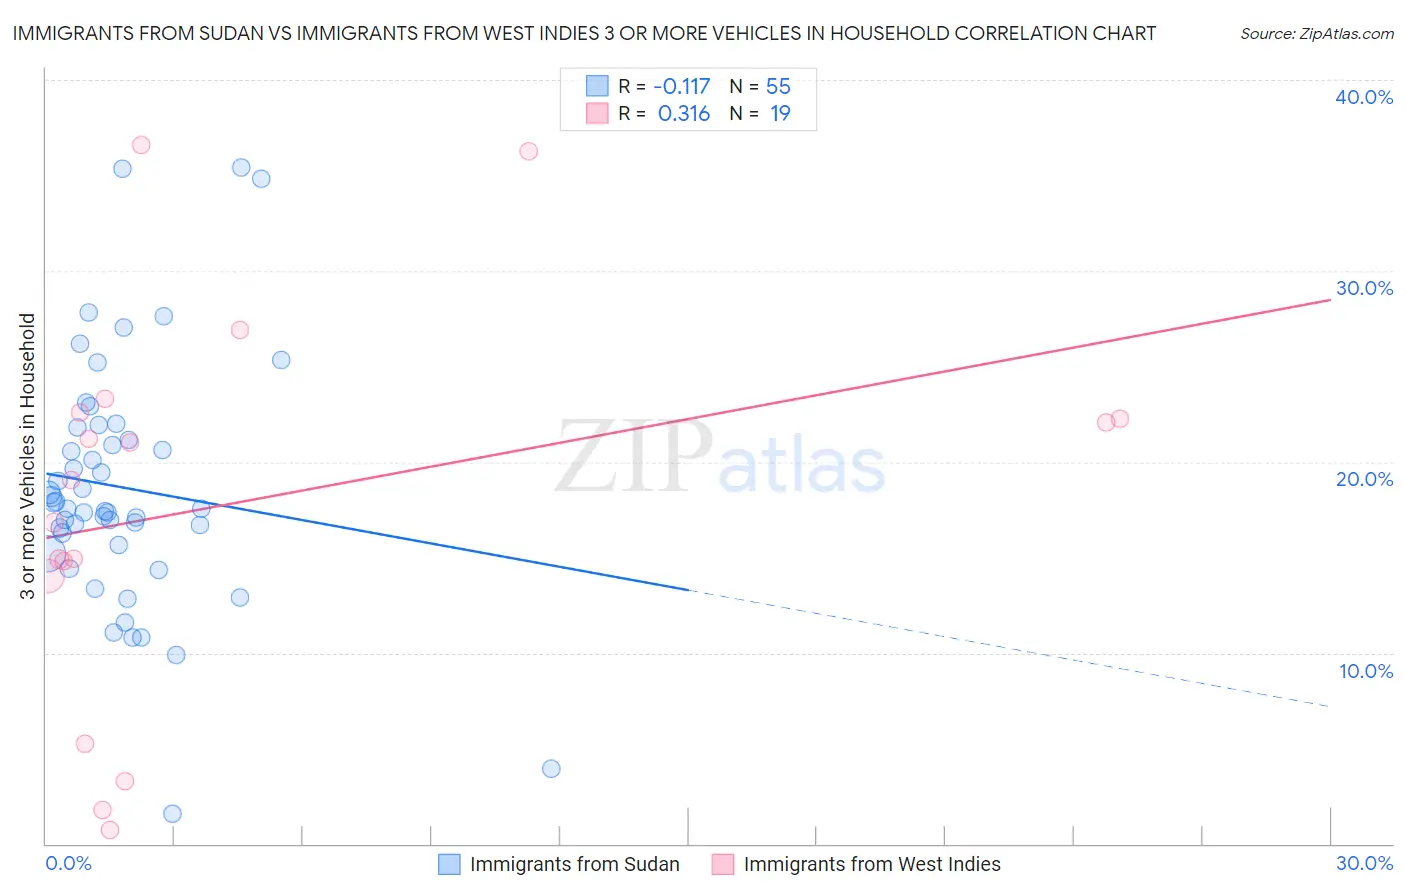
Immigrants from Sudan vs Immigrants from West Indies 3 or more Vehicles in Household Correlation Chart
The statistical analysis conducted on geographies consisting of 118,948,382 people shows a poor negative correlation between the proportion of Immigrants from Sudan and percentage of households with 3 or more vehicles available in the United States with a correlation coefficient (R) of -0.117 and weighted average of 17.6%. Similarly, the statistical analysis conducted on geographies consisting of 72,454,628 people shows a mild positive correlation between the proportion of Immigrants from West Indies and percentage of households with 3 or more vehicles available in the United States with a correlation coefficient (R) of 0.316 and weighted average of 14.6%, a difference of 20.0%.
3 or more Vehicles in Household Correlation Summary
| Measurement | Immigrants from Sudan | Immigrants from West Indies |
| Minimum | 1.5% | 0.69% |
| Maximum | 35.4% | 36.6% |
| Range | 33.8% | 35.9% |
| Mean | 18.6% | 17.8% |
| Median | 17.6% | 19.1% |
| Interquartile 25% (IQ1) | 15.6% | 14.0% |
| Interquartile 75% (IQ3) | 21.8% | 22.6% |
| Interquartile Range (IQR) | 6.2% | 8.5% |
| Standard Deviation (Sample) | 6.5% | 10.1% |
| Standard Deviation (Population) | 6.5% | 9.9% |
Similar Demographics by 3 or more Vehicles in Household
Demographics Similar to Immigrants from Sudan by 3 or more Vehicles in Household
In terms of 3 or more vehicles in household, the demographic groups most similar to Immigrants from Sudan are Immigrants from Africa (17.6%, a difference of 0.040%), Immigrants from Bosnia and Herzegovina (17.5%, a difference of 0.15%), Immigrants from Ukraine (17.5%, a difference of 0.44%), Immigrants from Nepal (17.6%, a difference of 0.45%), and South American (17.6%, a difference of 0.45%).
| Demographics | Rating | Rank | 3 or more Vehicles in Household |
| Macedonians | 0.8 /100 | #266 | Tragic 17.7% |
| Immigrants | Venezuela | 0.8 /100 | #267 | Tragic 17.7% |
| Immigrants | Bulgaria | 0.8 /100 | #268 | Tragic 17.7% |
| Immigrants | France | 0.6 /100 | #269 | Tragic 17.6% |
| Immigrants | Nepal | 0.6 /100 | #270 | Tragic 17.6% |
| South Americans | 0.6 /100 | #271 | Tragic 17.6% |
| Immigrants | Africa | 0.5 /100 | #272 | Tragic 17.6% |
| Immigrants | Sudan | 0.5 /100 | #273 | Tragic 17.6% |
| Immigrants | Bosnia and Herzegovina | 0.5 /100 | #274 | Tragic 17.5% |
| Immigrants | Ukraine | 0.4 /100 | #275 | Tragic 17.5% |
| Okinawans | 0.4 /100 | #276 | Tragic 17.4% |
| Brazilians | 0.4 /100 | #277 | Tragic 17.4% |
| Immigrants | Bahamas | 0.3 /100 | #278 | Tragic 17.4% |
| Immigrants | Kazakhstan | 0.3 /100 | #279 | Tragic 17.4% |
| Immigrants | Eastern Europe | 0.3 /100 | #280 | Tragic 17.4% |
Demographics Similar to Immigrants from West Indies by 3 or more Vehicles in Household
In terms of 3 or more vehicles in household, the demographic groups most similar to Immigrants from West Indies are Immigrants from Jamaica (14.7%, a difference of 0.31%), Immigrants from Caribbean (14.6%, a difference of 0.44%), Yup'ik (14.8%, a difference of 1.4%), Cape Verdean (15.0%, a difference of 2.5%), and Immigrants from Yemen (14.2%, a difference of 2.8%).
| Demographics | Rating | Rank | 3 or more Vehicles in Household |
| Haitians | 0.0 /100 | #315 | Tragic 15.5% |
| U.S. Virgin Islanders | 0.0 /100 | #316 | Tragic 15.4% |
| Jamaicans | 0.0 /100 | #317 | Tragic 15.2% |
| Immigrants | Haiti | 0.0 /100 | #318 | Tragic 15.2% |
| Cape Verdeans | 0.0 /100 | #319 | Tragic 15.0% |
| Yup'ik | 0.0 /100 | #320 | Tragic 14.8% |
| Immigrants | Jamaica | 0.0 /100 | #321 | Tragic 14.7% |
| Immigrants | West Indies | 0.0 /100 | #322 | Tragic 14.6% |
| Immigrants | Caribbean | 0.0 /100 | #323 | Tragic 14.6% |
| Immigrants | Yemen | 0.0 /100 | #324 | Tragic 14.2% |
| Senegalese | 0.0 /100 | #325 | Tragic 14.2% |
| Soviet Union | 0.0 /100 | #326 | Tragic 14.2% |
| Ecuadorians | 0.0 /100 | #327 | Tragic 14.1% |
| Immigrants | Albania | 0.0 /100 | #328 | Tragic 14.0% |
| Immigrants | Senegal | 0.0 /100 | #329 | Tragic 13.8% |