Immigrants from Sudan vs Taiwanese 3 or more Vehicles in Household
COMPARE
Immigrants from Sudan
Taiwanese
3 or more Vehicles in Household
3 or more Vehicles in Household Comparison
Immigrants from Sudan
Taiwanese
17.6%
3 OR MORE VEHICLES IN HOUSEHOLD
0.5/ 100
METRIC RATING
273rd/ 347
METRIC RANK
20.0%
3 OR MORE VEHICLES IN HOUSEHOLD
80.6/ 100
METRIC RATING
151st/ 347
METRIC RANK
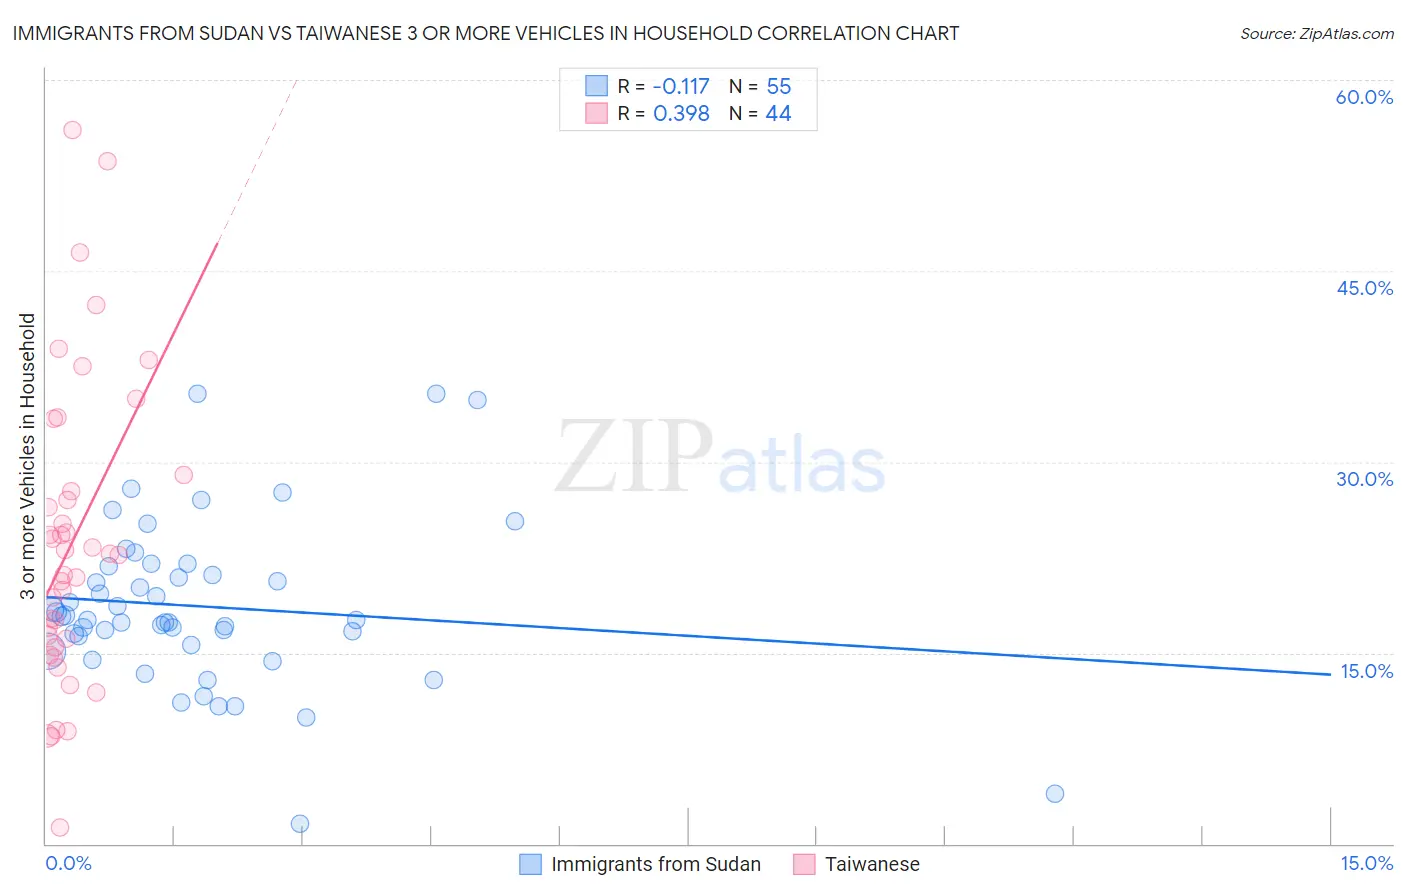
Immigrants from Sudan vs Taiwanese 3 or more Vehicles in Household Correlation Chart
The statistical analysis conducted on geographies consisting of 118,948,382 people shows a poor negative correlation between the proportion of Immigrants from Sudan and percentage of households with 3 or more vehicles available in the United States with a correlation coefficient (R) of -0.117 and weighted average of 17.6%. Similarly, the statistical analysis conducted on geographies consisting of 31,709,765 people shows a mild positive correlation between the proportion of Taiwanese and percentage of households with 3 or more vehicles available in the United States with a correlation coefficient (R) of 0.398 and weighted average of 20.0%, a difference of 14.1%.
3 or more Vehicles in Household Correlation Summary
| Measurement | Immigrants from Sudan | Taiwanese |
| Minimum | 1.5% | 1.3% |
| Maximum | 35.4% | 56.1% |
| Range | 33.8% | 54.8% |
| Mean | 18.6% | 23.7% |
| Median | 17.6% | 22.7% |
| Interquartile 25% (IQ1) | 15.6% | 15.8% |
| Interquartile 75% (IQ3) | 21.8% | 28.3% |
| Interquartile Range (IQR) | 6.2% | 12.5% |
| Standard Deviation (Sample) | 6.5% | 11.9% |
| Standard Deviation (Population) | 6.5% | 11.8% |
Similar Demographics by 3 or more Vehicles in Household
Demographics Similar to Immigrants from Sudan by 3 or more Vehicles in Household
In terms of 3 or more vehicles in household, the demographic groups most similar to Immigrants from Sudan are Immigrants from Africa (17.6%, a difference of 0.040%), Immigrants from Bosnia and Herzegovina (17.5%, a difference of 0.15%), Immigrants from Ukraine (17.5%, a difference of 0.44%), Immigrants from Nepal (17.6%, a difference of 0.45%), and South American (17.6%, a difference of 0.45%).
| Demographics | Rating | Rank | 3 or more Vehicles in Household |
| Macedonians | 0.8 /100 | #266 | Tragic 17.7% |
| Immigrants | Venezuela | 0.8 /100 | #267 | Tragic 17.7% |
| Immigrants | Bulgaria | 0.8 /100 | #268 | Tragic 17.7% |
| Immigrants | France | 0.6 /100 | #269 | Tragic 17.6% |
| Immigrants | Nepal | 0.6 /100 | #270 | Tragic 17.6% |
| South Americans | 0.6 /100 | #271 | Tragic 17.6% |
| Immigrants | Africa | 0.5 /100 | #272 | Tragic 17.6% |
| Immigrants | Sudan | 0.5 /100 | #273 | Tragic 17.6% |
| Immigrants | Bosnia and Herzegovina | 0.5 /100 | #274 | Tragic 17.5% |
| Immigrants | Ukraine | 0.4 /100 | #275 | Tragic 17.5% |
| Okinawans | 0.4 /100 | #276 | Tragic 17.4% |
| Brazilians | 0.4 /100 | #277 | Tragic 17.4% |
| Immigrants | Bahamas | 0.3 /100 | #278 | Tragic 17.4% |
| Immigrants | Kazakhstan | 0.3 /100 | #279 | Tragic 17.4% |
| Immigrants | Eastern Europe | 0.3 /100 | #280 | Tragic 17.4% |
Demographics Similar to Taiwanese by 3 or more Vehicles in Household
In terms of 3 or more vehicles in household, the demographic groups most similar to Taiwanese are Immigrants (20.0%, a difference of 0.020%), Immigrants from Iran (20.0%, a difference of 0.030%), Lebanese (20.0%, a difference of 0.10%), Guatemalan (20.1%, a difference of 0.24%), and Slovak (20.1%, a difference of 0.29%).
| Demographics | Rating | Rank | 3 or more Vehicles in Household |
| Iranians | 84.0 /100 | #144 | Excellent 20.1% |
| Palestinians | 83.9 /100 | #145 | Excellent 20.1% |
| Australians | 83.6 /100 | #146 | Excellent 20.1% |
| Slovaks | 83.0 /100 | #147 | Excellent 20.1% |
| Guatemalans | 82.6 /100 | #148 | Excellent 20.1% |
| Immigrants | Iran | 80.9 /100 | #149 | Excellent 20.0% |
| Immigrants | Immigrants | 80.8 /100 | #150 | Excellent 20.0% |
| Taiwanese | 80.6 /100 | #151 | Excellent 20.0% |
| Lebanese | 79.8 /100 | #152 | Good 20.0% |
| Yuman | 75.6 /100 | #153 | Good 19.9% |
| Immigrants | Jordan | 75.0 /100 | #154 | Good 19.9% |
| Tlingit-Haida | 73.4 /100 | #155 | Good 19.9% |
| Thais | 71.1 /100 | #156 | Good 19.8% |
| Hungarians | 70.5 /100 | #157 | Good 19.8% |
| Armenians | 68.8 /100 | #158 | Good 19.8% |