Immigrants from Sudan vs Spanish American In Labor Force | Age 35-44
COMPARE
Immigrants from Sudan
Spanish American
In Labor Force | Age 35-44
In Labor Force | Age 35-44 Comparison
Immigrants from Sudan
Spanish Americans
84.9%
IN LABOR FORCE | AGE 35-44
98.1/ 100
METRIC RATING
82nd/ 347
METRIC RANK
82.8%
IN LABOR FORCE | AGE 35-44
0.0/ 100
METRIC RATING
293rd/ 347
METRIC RANK
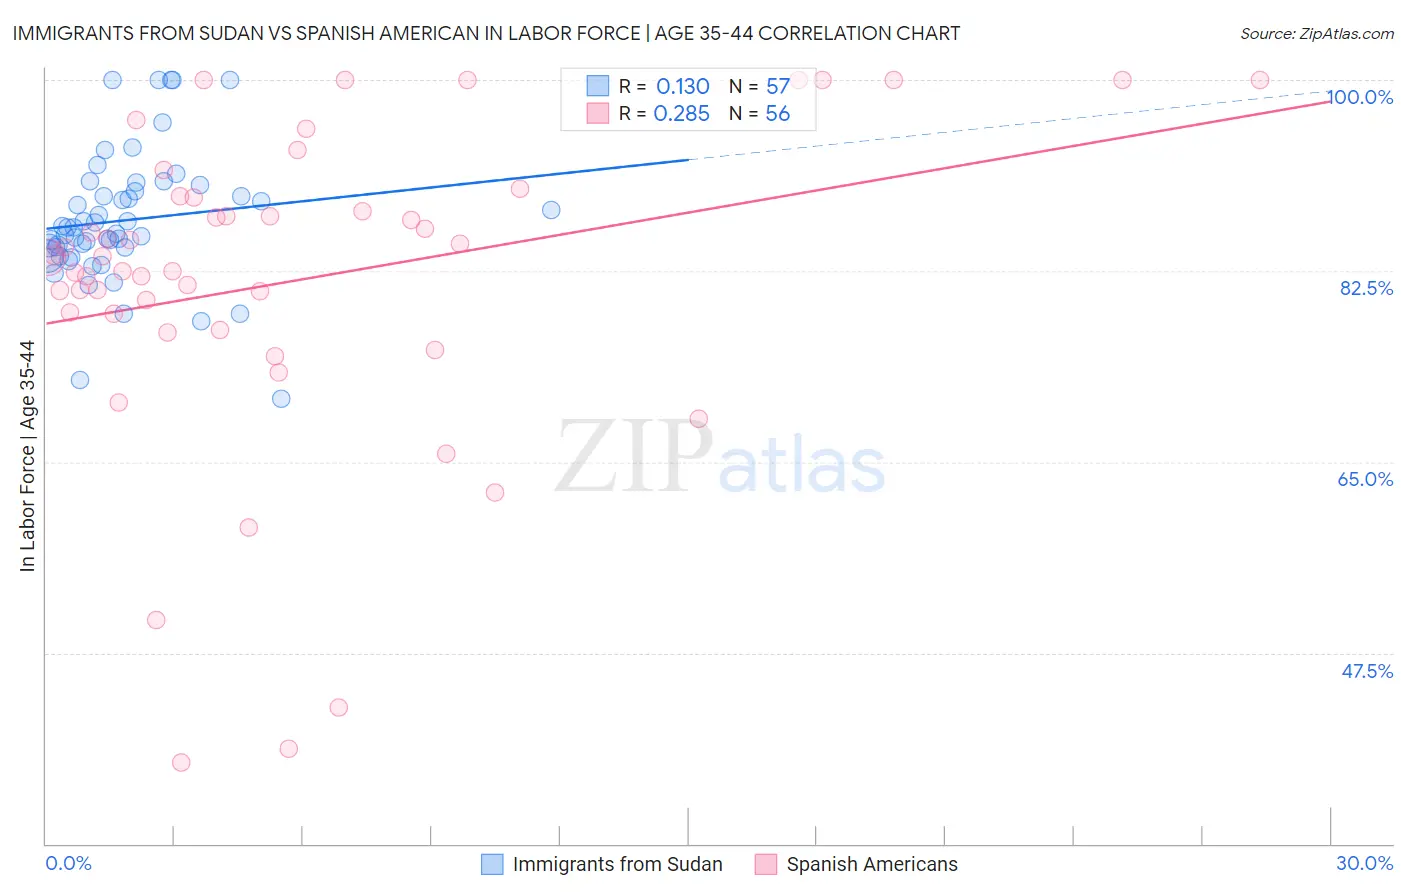
Immigrants from Sudan vs Spanish American In Labor Force | Age 35-44 Correlation Chart
The statistical analysis conducted on geographies consisting of 118,957,461 people shows a poor positive correlation between the proportion of Immigrants from Sudan and labor force participation rate among population between the ages 35 and 44 in the United States with a correlation coefficient (R) of 0.130 and weighted average of 84.9%. Similarly, the statistical analysis conducted on geographies consisting of 103,164,815 people shows a weak positive correlation between the proportion of Spanish Americans and labor force participation rate among population between the ages 35 and 44 in the United States with a correlation coefficient (R) of 0.285 and weighted average of 82.8%, a difference of 2.6%.
In Labor Force | Age 35-44 Correlation Summary
| Measurement | Immigrants from Sudan | Spanish American |
| Minimum | 70.8% | 37.5% |
| Maximum | 100.0% | 100.0% |
| Range | 29.2% | 62.5% |
| Mean | 87.2% | 81.7% |
| Median | 86.5% | 83.8% |
| Interquartile 25% (IQ1) | 84.2% | 77.8% |
| Interquartile 75% (IQ3) | 90.1% | 89.2% |
| Interquartile Range (IQR) | 5.8% | 11.4% |
| Standard Deviation (Sample) | 6.1% | 14.6% |
| Standard Deviation (Population) | 6.0% | 14.5% |
Similar Demographics by In Labor Force | Age 35-44
Demographics Similar to Immigrants from Sudan by In Labor Force | Age 35-44
In terms of in labor force | age 35-44, the demographic groups most similar to Immigrants from Sudan are Peruvian (84.9%, a difference of 0.020%), Immigrants from Colombia (84.9%, a difference of 0.020%), Immigrants from Eastern Europe (84.9%, a difference of 0.020%), Senegalese (84.9%, a difference of 0.020%), and Immigrants from Peru (84.9%, a difference of 0.020%).
| Demographics | Rating | Rank | In Labor Force | Age 35-44 |
| Immigrants | South Central Asia | 98.7 /100 | #75 | Exceptional 85.0% |
| Immigrants | Cuba | 98.6 /100 | #76 | Exceptional 84.9% |
| Immigrants | Turkey | 98.6 /100 | #77 | Exceptional 84.9% |
| Immigrants | Africa | 98.4 /100 | #78 | Exceptional 84.9% |
| Peruvians | 98.3 /100 | #79 | Exceptional 84.9% |
| Immigrants | Colombia | 98.3 /100 | #80 | Exceptional 84.9% |
| Immigrants | Eastern Europe | 98.3 /100 | #81 | Exceptional 84.9% |
| Immigrants | Sudan | 98.1 /100 | #82 | Exceptional 84.9% |
| Senegalese | 97.8 /100 | #83 | Exceptional 84.9% |
| Immigrants | Peru | 97.8 /100 | #84 | Exceptional 84.9% |
| Immigrants | Middle Africa | 97.8 /100 | #85 | Exceptional 84.9% |
| Greeks | 97.8 /100 | #86 | Exceptional 84.9% |
| Belgians | 97.7 /100 | #87 | Exceptional 84.9% |
| Yugoslavians | 97.7 /100 | #88 | Exceptional 84.9% |
| Immigrants | Pakistan | 97.5 /100 | #89 | Exceptional 84.9% |
Demographics Similar to Spanish Americans by In Labor Force | Age 35-44
In terms of in labor force | age 35-44, the demographic groups most similar to Spanish Americans are Potawatomi (82.7%, a difference of 0.080%), Immigrants from Latin America (82.8%, a difference of 0.090%), Immigrants from Lebanon (82.7%, a difference of 0.13%), Pennsylvania German (82.9%, a difference of 0.14%), and African (82.9%, a difference of 0.16%).
| Demographics | Rating | Rank | In Labor Force | Age 35-44 |
| Immigrants | Bangladesh | 0.0 /100 | #286 | Tragic 82.9% |
| Immigrants | Belize | 0.0 /100 | #287 | Tragic 82.9% |
| Puget Sound Salish | 0.0 /100 | #288 | Tragic 82.9% |
| Chippewa | 0.0 /100 | #289 | Tragic 82.9% |
| Africans | 0.0 /100 | #290 | Tragic 82.9% |
| Pennsylvania Germans | 0.0 /100 | #291 | Tragic 82.9% |
| Immigrants | Latin America | 0.0 /100 | #292 | Tragic 82.8% |
| Spanish Americans | 0.0 /100 | #293 | Tragic 82.8% |
| Potawatomi | 0.0 /100 | #294 | Tragic 82.7% |
| Immigrants | Lebanon | 0.0 /100 | #295 | Tragic 82.7% |
| Mexican American Indians | 0.0 /100 | #296 | Tragic 82.6% |
| Hmong | 0.0 /100 | #297 | Tragic 82.6% |
| Ottawa | 0.0 /100 | #298 | Tragic 82.6% |
| Tlingit-Haida | 0.0 /100 | #299 | Tragic 82.5% |
| Central American Indians | 0.0 /100 | #300 | Tragic 82.5% |