Burmese vs Immigrants from Spain 2 or more Vehicles in Household
COMPARE
Burmese
Immigrants from Spain
2 or more Vehicles in Household
2 or more Vehicles in Household Comparison
Burmese
Immigrants from Spain
57.8%
2 OR MORE VEHICLES IN HOUSEHOLD
98.8/ 100
METRIC RATING
96th/ 347
METRIC RANK
50.4%
2 OR MORE VEHICLES IN HOUSEHOLD
0.0/ 100
METRIC RATING
297th/ 347
METRIC RANK
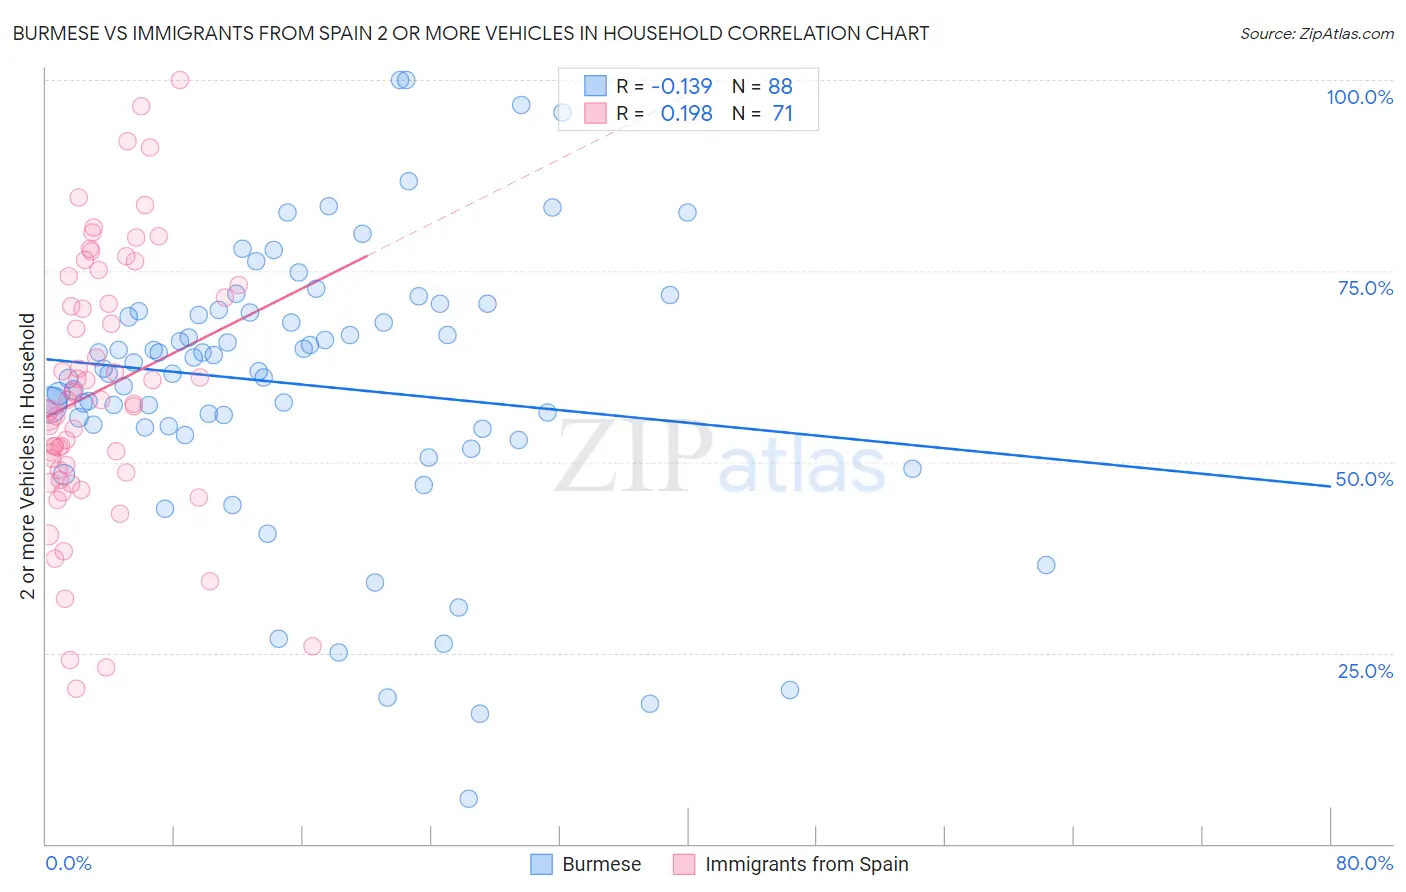
Burmese vs Immigrants from Spain 2 or more Vehicles in Household Correlation Chart
The statistical analysis conducted on geographies consisting of 464,950,170 people shows a poor negative correlation between the proportion of Burmese and percentage of households with 2 or more vehicles available in the United States with a correlation coefficient (R) of -0.139 and weighted average of 57.8%. Similarly, the statistical analysis conducted on geographies consisting of 239,620,026 people shows a poor positive correlation between the proportion of Immigrants from Spain and percentage of households with 2 or more vehicles available in the United States with a correlation coefficient (R) of 0.198 and weighted average of 50.4%, a difference of 14.7%.
2 or more Vehicles in Household Correlation Summary
| Measurement | Burmese | Immigrants from Spain |
| Minimum | 5.9% | 20.3% |
| Maximum | 100.0% | 100.0% |
| Range | 94.1% | 79.7% |
| Mean | 60.1% | 59.4% |
| Median | 62.0% | 58.2% |
| Interquartile 25% (IQ1) | 54.5% | 48.7% |
| Interquartile 75% (IQ3) | 69.7% | 73.2% |
| Interquartile Range (IQR) | 15.2% | 24.6% |
| Standard Deviation (Sample) | 18.3% | 17.4% |
| Standard Deviation (Population) | 18.2% | 17.3% |
Similar Demographics by 2 or more Vehicles in Household
Demographics Similar to Burmese by 2 or more Vehicles in Household
In terms of 2 or more vehicles in household, the demographic groups most similar to Burmese are Slavic (57.8%, a difference of 0.020%), Hmong (57.8%, a difference of 0.030%), Filipino (57.8%, a difference of 0.060%), Shoshone (57.9%, a difference of 0.12%), and Ottawa (57.9%, a difference of 0.12%).
| Demographics | Rating | Rank | 2 or more Vehicles in Household |
| Immigrants | Germany | 99.0 /100 | #89 | Exceptional 57.9% |
| Hispanics or Latinos | 99.0 /100 | #90 | Exceptional 57.9% |
| Pakistanis | 99.0 /100 | #91 | Exceptional 57.9% |
| Shoshone | 99.0 /100 | #92 | Exceptional 57.9% |
| Ottawa | 99.0 /100 | #93 | Exceptional 57.9% |
| Filipinos | 98.9 /100 | #94 | Exceptional 57.8% |
| Hmong | 98.9 /100 | #95 | Exceptional 57.8% |
| Burmese | 98.8 /100 | #96 | Exceptional 57.8% |
| Slavs | 98.8 /100 | #97 | Exceptional 57.8% |
| Palestinians | 98.6 /100 | #98 | Exceptional 57.7% |
| Cajuns | 98.5 /100 | #99 | Exceptional 57.7% |
| Fijians | 98.4 /100 | #100 | Exceptional 57.6% |
| Lebanese | 98.3 /100 | #101 | Exceptional 57.6% |
| Immigrants | Bolivia | 98.2 /100 | #102 | Exceptional 57.6% |
| Jordanians | 98.2 /100 | #103 | Exceptional 57.6% |
Demographics Similar to Immigrants from Spain by 2 or more Vehicles in Household
In terms of 2 or more vehicles in household, the demographic groups most similar to Immigrants from Spain are Paraguayan (50.3%, a difference of 0.13%), Immigrants from Morocco (50.3%, a difference of 0.16%), Immigrants from Russia (50.3%, a difference of 0.20%), Immigrants from Somalia (50.5%, a difference of 0.27%), and Cypriot (50.6%, a difference of 0.31%).
| Demographics | Rating | Rank | 2 or more Vehicles in Household |
| Immigrants | Panama | 0.0 /100 | #290 | Tragic 51.1% |
| Belizeans | 0.0 /100 | #291 | Tragic 51.0% |
| Immigrants | Ukraine | 0.0 /100 | #292 | Tragic 50.9% |
| Blacks/African Americans | 0.0 /100 | #293 | Tragic 50.9% |
| Bermudans | 0.0 /100 | #294 | Tragic 50.6% |
| Cypriots | 0.0 /100 | #295 | Tragic 50.6% |
| Immigrants | Somalia | 0.0 /100 | #296 | Tragic 50.5% |
| Immigrants | Spain | 0.0 /100 | #297 | Tragic 50.4% |
| Paraguayans | 0.0 /100 | #298 | Tragic 50.3% |
| Immigrants | Morocco | 0.0 /100 | #299 | Tragic 50.3% |
| Immigrants | Russia | 0.0 /100 | #300 | Tragic 50.3% |
| Immigrants | Greece | 0.0 /100 | #301 | Tragic 50.2% |
| Immigrants | South America | 0.0 /100 | #302 | Tragic 50.2% |
| Tohono O'odham | 0.0 /100 | #303 | Tragic 50.0% |
| Immigrants | Belize | 0.0 /100 | #304 | Tragic 49.9% |