Immigrants from St. Vincent and the Grenadines vs Immigrants from Africa 3 or more Vehicles in Household
COMPARE
Immigrants from St. Vincent and the Grenadines
Immigrants from Africa
3 or more Vehicles in Household
3 or more Vehicles in Household Comparison
Immigrants from St. Vincent and the Grenadines
Immigrants from Africa
10.1%
3 OR MORE VEHICLES IN HOUSEHOLD
0.0/ 100
METRIC RATING
346th/ 347
METRIC RANK
17.6%
3 OR MORE VEHICLES IN HOUSEHOLD
0.5/ 100
METRIC RATING
272nd/ 347
METRIC RANK
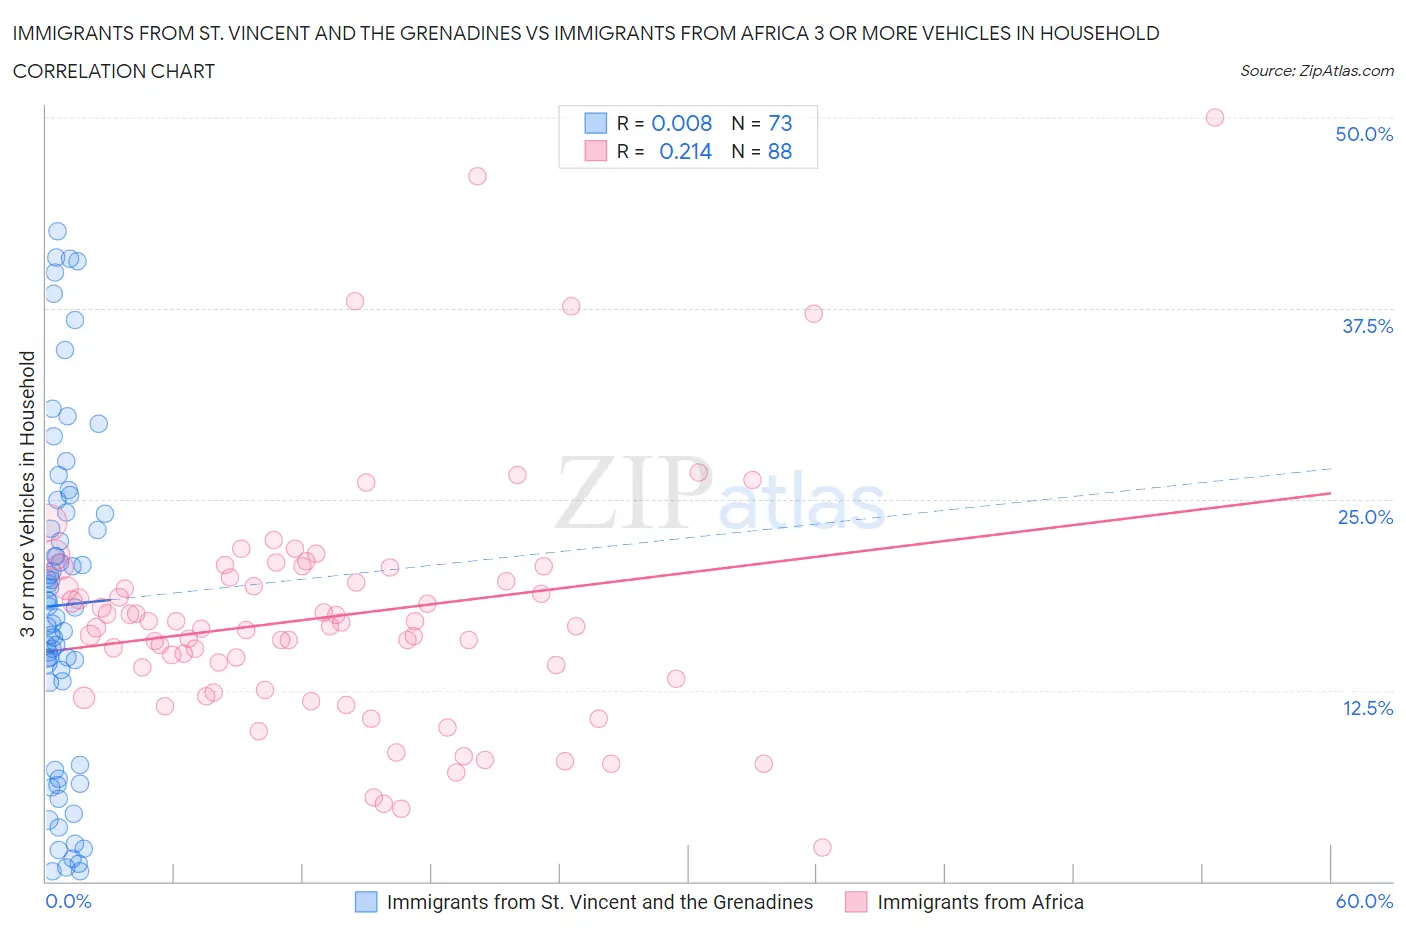
Immigrants from St. Vincent and the Grenadines vs Immigrants from Africa 3 or more Vehicles in Household Correlation Chart
The statistical analysis conducted on geographies consisting of 56,188,620 people shows no correlation between the proportion of Immigrants from St. Vincent and the Grenadines and percentage of households with 3 or more vehicles available in the United States with a correlation coefficient (R) of 0.008 and weighted average of 10.1%. Similarly, the statistical analysis conducted on geographies consisting of 468,754,030 people shows a weak positive correlation between the proportion of Immigrants from Africa and percentage of households with 3 or more vehicles available in the United States with a correlation coefficient (R) of 0.214 and weighted average of 17.6%, a difference of 74.6%.
3 or more Vehicles in Household Correlation Summary
| Measurement | Immigrants from St. Vincent and the Grenadines | Immigrants from Africa |
| Minimum | 0.62% | 2.2% |
| Maximum | 42.6% | 50.0% |
| Range | 42.0% | 47.8% |
| Mean | 18.1% | 17.4% |
| Median | 17.9% | 16.7% |
| Interquartile 25% (IQ1) | 10.3% | 12.9% |
| Interquartile 75% (IQ3) | 24.1% | 20.2% |
| Interquartile Range (IQR) | 13.8% | 7.3% |
| Standard Deviation (Sample) | 11.0% | 8.0% |
| Standard Deviation (Population) | 10.9% | 7.9% |
Similar Demographics by 3 or more Vehicles in Household
Demographics Similar to Immigrants from St. Vincent and the Grenadines by 3 or more Vehicles in Household
In terms of 3 or more vehicles in household, the demographic groups most similar to Immigrants from St. Vincent and the Grenadines are Immigrants from Dominican Republic (10.4%, a difference of 3.7%), Immigrants from Grenada (9.1%, a difference of 10.6%), Dominican (11.2%, a difference of 11.7%), Immigrants from Guyana (11.2%, a difference of 11.8%), and British West Indian (11.4%, a difference of 13.9%).
| Demographics | Rating | Rank | 3 or more Vehicles in Household |
| Immigrants | Cabo Verde | 0.0 /100 | #333 | Tragic 13.6% |
| Immigrants | Ecuador | 0.0 /100 | #334 | Tragic 13.4% |
| Immigrants | Trinidad and Tobago | 0.0 /100 | #335 | Tragic 13.3% |
| Barbadians | 0.0 /100 | #336 | Tragic 12.6% |
| Immigrants | Bangladesh | 0.0 /100 | #337 | Tragic 12.5% |
| Vietnamese | 0.0 /100 | #338 | Tragic 12.5% |
| Immigrants | Uzbekistan | 0.0 /100 | #339 | Tragic 12.0% |
| Immigrants | Barbados | 0.0 /100 | #340 | Tragic 11.7% |
| Guyanese | 0.0 /100 | #341 | Tragic 11.5% |
| British West Indians | 0.0 /100 | #342 | Tragic 11.4% |
| Immigrants | Guyana | 0.0 /100 | #343 | Tragic 11.2% |
| Dominicans | 0.0 /100 | #344 | Tragic 11.2% |
| Immigrants | Dominican Republic | 0.0 /100 | #345 | Tragic 10.4% |
| Immigrants | St. Vincent and the Grenadines | 0.0 /100 | #346 | Tragic 10.1% |
| Immigrants | Grenada | 0.0 /100 | #347 | Tragic 9.1% |
Demographics Similar to Immigrants from Africa by 3 or more Vehicles in Household
In terms of 3 or more vehicles in household, the demographic groups most similar to Immigrants from Africa are Immigrants from Sudan (17.6%, a difference of 0.040%), Immigrants from Bosnia and Herzegovina (17.5%, a difference of 0.18%), Immigrants from Nepal (17.6%, a difference of 0.41%), South American (17.6%, a difference of 0.41%), and Immigrants from France (17.6%, a difference of 0.46%).
| Demographics | Rating | Rank | 3 or more Vehicles in Household |
| Immigrants | Panama | 0.8 /100 | #265 | Tragic 17.7% |
| Macedonians | 0.8 /100 | #266 | Tragic 17.7% |
| Immigrants | Venezuela | 0.8 /100 | #267 | Tragic 17.7% |
| Immigrants | Bulgaria | 0.8 /100 | #268 | Tragic 17.7% |
| Immigrants | France | 0.6 /100 | #269 | Tragic 17.6% |
| Immigrants | Nepal | 0.6 /100 | #270 | Tragic 17.6% |
| South Americans | 0.6 /100 | #271 | Tragic 17.6% |
| Immigrants | Africa | 0.5 /100 | #272 | Tragic 17.6% |
| Immigrants | Sudan | 0.5 /100 | #273 | Tragic 17.6% |
| Immigrants | Bosnia and Herzegovina | 0.5 /100 | #274 | Tragic 17.5% |
| Immigrants | Ukraine | 0.4 /100 | #275 | Tragic 17.5% |
| Okinawans | 0.4 /100 | #276 | Tragic 17.4% |
| Brazilians | 0.4 /100 | #277 | Tragic 17.4% |
| Immigrants | Bahamas | 0.3 /100 | #278 | Tragic 17.4% |
| Immigrants | Kazakhstan | 0.3 /100 | #279 | Tragic 17.4% |