Immigrants from St. Vincent and the Grenadines vs Dominican Female Disability
COMPARE
Immigrants from St. Vincent and the Grenadines
Dominican
Female Disability
Female Disability Comparison
Immigrants from St. Vincent and the Grenadines
Dominicans
12.2%
FEMALE DISABILITY
49.7/ 100
METRIC RATING
175th/ 347
METRIC RANK
13.5%
FEMALE DISABILITY
0.0/ 100
METRIC RATING
305th/ 347
METRIC RANK
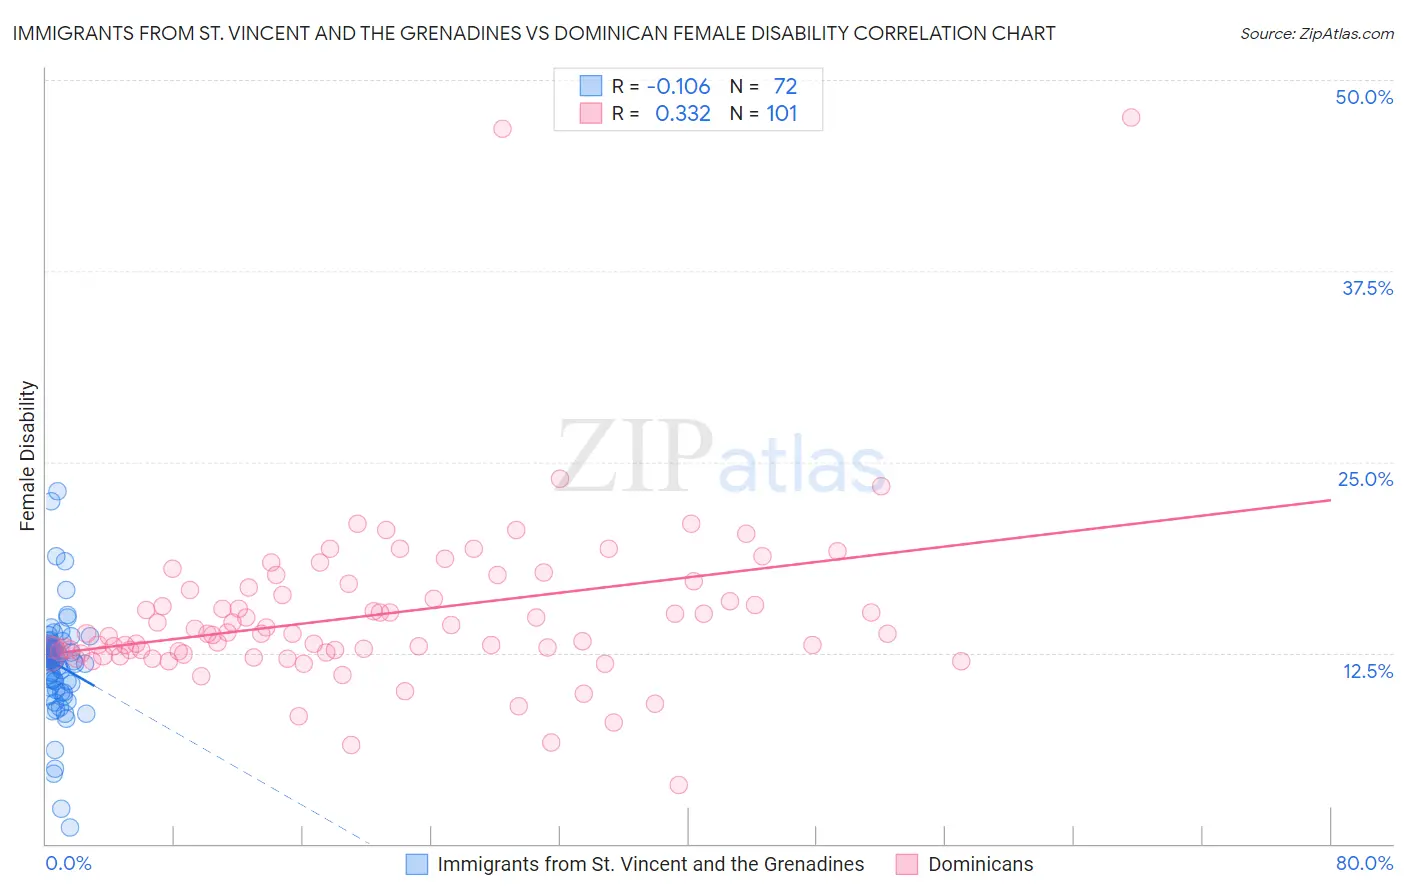
Immigrants from St. Vincent and the Grenadines vs Dominican Female Disability Correlation Chart
The statistical analysis conducted on geographies consisting of 56,175,072 people shows a poor negative correlation between the proportion of Immigrants from St. Vincent and the Grenadines and percentage of females with a disability in the United States with a correlation coefficient (R) of -0.106 and weighted average of 12.2%. Similarly, the statistical analysis conducted on geographies consisting of 355,036,976 people shows a mild positive correlation between the proportion of Dominicans and percentage of females with a disability in the United States with a correlation coefficient (R) of 0.332 and weighted average of 13.5%, a difference of 10.6%.
Female Disability Correlation Summary
| Measurement | Immigrants from St. Vincent and the Grenadines | Dominican |
| Minimum | 1.1% | 3.9% |
| Maximum | 23.1% | 47.5% |
| Range | 22.0% | 43.7% |
| Mean | 11.7% | 15.0% |
| Median | 12.0% | 13.8% |
| Interquartile 25% (IQ1) | 10.1% | 12.5% |
| Interquartile 75% (IQ3) | 12.9% | 16.7% |
| Interquartile Range (IQR) | 2.8% | 4.2% |
| Standard Deviation (Sample) | 3.5% | 5.8% |
| Standard Deviation (Population) | 3.5% | 5.7% |
Similar Demographics by Female Disability
Demographics Similar to Immigrants from St. Vincent and the Grenadines by Female Disability
In terms of female disability, the demographic groups most similar to Immigrants from St. Vincent and the Grenadines are Immigrants from England (12.2%, a difference of 0.010%), Immigrants from Mexico (12.2%, a difference of 0.040%), Haitian (12.2%, a difference of 0.080%), Immigrants from Southern Europe (12.2%, a difference of 0.25%), and Immigrants from Guyana (12.2%, a difference of 0.25%).
| Demographics | Rating | Rank | Female Disability |
| Immigrants | Haiti | 58.8 /100 | #168 | Average 12.2% |
| Lebanese | 58.1 /100 | #169 | Average 12.2% |
| Maltese | 57.0 /100 | #170 | Average 12.2% |
| Immigrants | Southern Europe | 56.3 /100 | #171 | Average 12.2% |
| Haitians | 51.9 /100 | #172 | Average 12.2% |
| Immigrants | Mexico | 50.8 /100 | #173 | Average 12.2% |
| Immigrants | England | 50.0 /100 | #174 | Average 12.2% |
| Immigrants | St. Vincent and the Grenadines | 49.7 /100 | #175 | Average 12.2% |
| Immigrants | Guyana | 43.1 /100 | #176 | Average 12.2% |
| Immigrants | Ghana | 42.5 /100 | #177 | Average 12.2% |
| Immigrants | Western Europe | 40.9 /100 | #178 | Average 12.2% |
| Immigrants | Fiji | 38.2 /100 | #179 | Fair 12.3% |
| Albanians | 37.9 /100 | #180 | Fair 12.3% |
| Immigrants | Canada | 37.2 /100 | #181 | Fair 12.3% |
| Norwegians | 36.9 /100 | #182 | Fair 12.3% |
Demographics Similar to Dominicans by Female Disability
In terms of female disability, the demographic groups most similar to Dominicans are Immigrants from Micronesia (13.5%, a difference of 0.31%), Immigrants from Portugal (13.5%, a difference of 0.34%), Scotch-Irish (13.4%, a difference of 0.35%), African (13.4%, a difference of 0.48%), and French Canadian (13.6%, a difference of 0.63%).
| Demographics | Rating | Rank | Female Disability |
| Immigrants | Nonimmigrants | 0.0 /100 | #298 | Tragic 13.4% |
| Immigrants | Dominican Republic | 0.0 /100 | #299 | Tragic 13.4% |
| Pennsylvania Germans | 0.0 /100 | #300 | Tragic 13.4% |
| Africans | 0.0 /100 | #301 | Tragic 13.4% |
| Scotch-Irish | 0.0 /100 | #302 | Tragic 13.4% |
| Immigrants | Portugal | 0.0 /100 | #303 | Tragic 13.5% |
| Immigrants | Micronesia | 0.0 /100 | #304 | Tragic 13.5% |
| Dominicans | 0.0 /100 | #305 | Tragic 13.5% |
| French Canadians | 0.0 /100 | #306 | Tragic 13.6% |
| Central American Indians | 0.0 /100 | #307 | Tragic 13.6% |
| Cree | 0.0 /100 | #308 | Tragic 13.7% |
| French American Indians | 0.0 /100 | #309 | Tragic 13.7% |
| Apache | 0.0 /100 | #310 | Tragic 13.7% |
| Hopi | 0.0 /100 | #311 | Tragic 13.7% |
| Delaware | 0.0 /100 | #312 | Tragic 13.8% |