Immigrants from St. Vincent and the Grenadines vs Hispanic or Latino 3 or more Vehicles in Household
COMPARE
Immigrants from St. Vincent and the Grenadines
Hispanic or Latino
3 or more Vehicles in Household
3 or more Vehicles in Household Comparison
Immigrants from St. Vincent and the Grenadines
Hispanics or Latinos
10.1%
3 OR MORE VEHICLES IN HOUSEHOLD
0.0/ 100
METRIC RATING
346th/ 347
METRIC RANK
22.4%
3 OR MORE VEHICLES IN HOUSEHOLD
100.0/ 100
METRIC RATING
56th/ 347
METRIC RANK
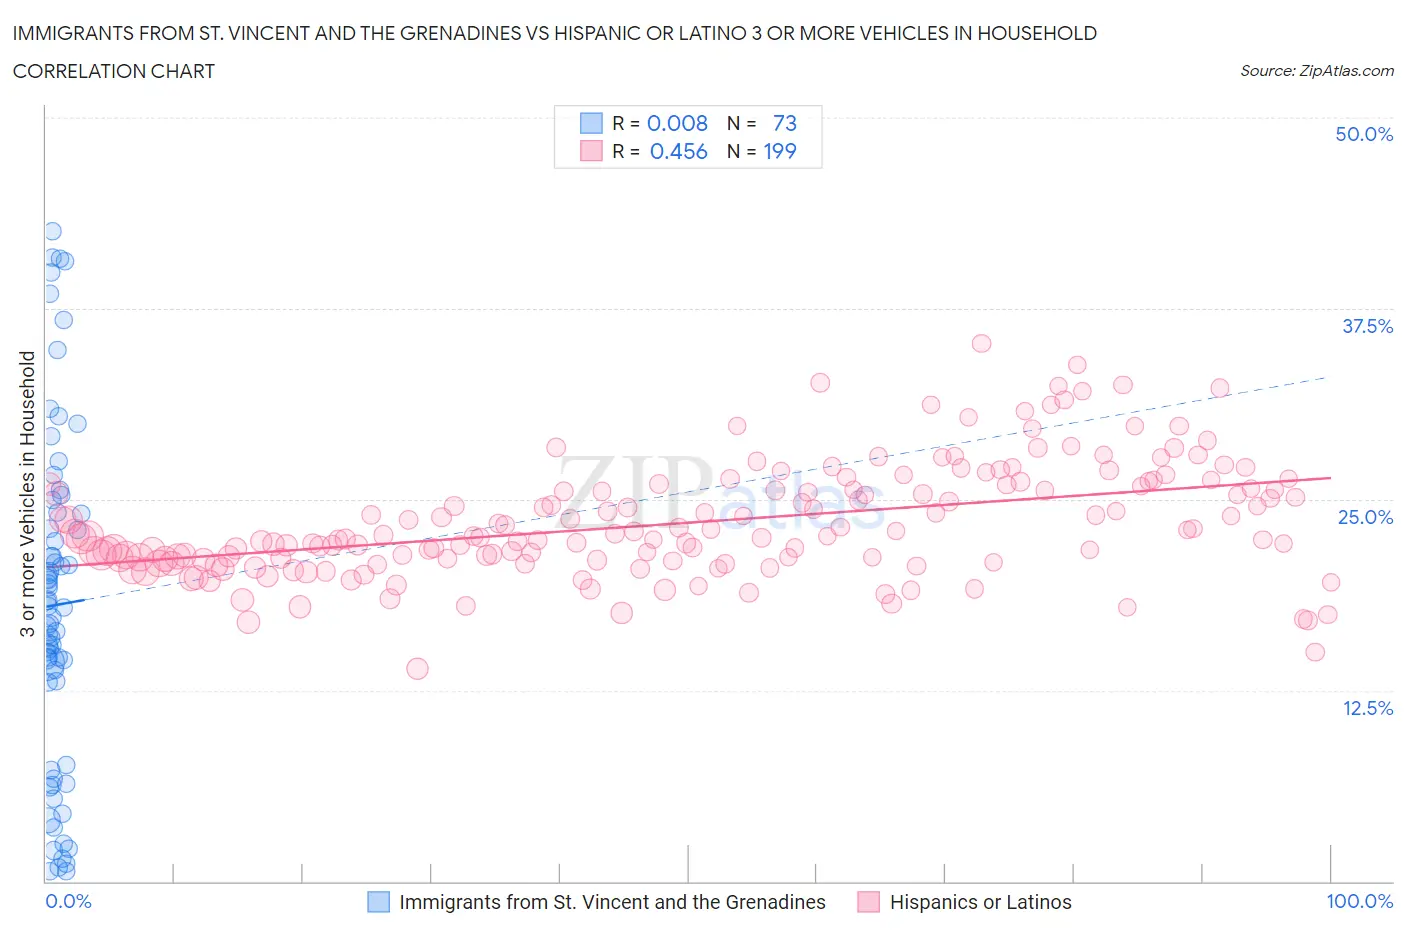
Immigrants from St. Vincent and the Grenadines vs Hispanic or Latino 3 or more Vehicles in Household Correlation Chart
The statistical analysis conducted on geographies consisting of 56,188,620 people shows no correlation between the proportion of Immigrants from St. Vincent and the Grenadines and percentage of households with 3 or more vehicles available in the United States with a correlation coefficient (R) of 0.008 and weighted average of 10.1%. Similarly, the statistical analysis conducted on geographies consisting of 563,449,459 people shows a moderate positive correlation between the proportion of Hispanics or Latinos and percentage of households with 3 or more vehicles available in the United States with a correlation coefficient (R) of 0.456 and weighted average of 22.4%, a difference of 122.6%.
3 or more Vehicles in Household Correlation Summary
| Measurement | Immigrants from St. Vincent and the Grenadines | Hispanic or Latino |
| Minimum | 0.62% | 13.9% |
| Maximum | 42.6% | 35.2% |
| Range | 42.0% | 21.3% |
| Mean | 18.1% | 23.5% |
| Median | 17.9% | 22.6% |
| Interquartile 25% (IQ1) | 10.3% | 21.1% |
| Interquartile 75% (IQ3) | 24.1% | 25.8% |
| Interquartile Range (IQR) | 13.8% | 4.8% |
| Standard Deviation (Sample) | 11.0% | 3.7% |
| Standard Deviation (Population) | 10.9% | 3.7% |
Similar Demographics by 3 or more Vehicles in Household
Demographics Similar to Immigrants from St. Vincent and the Grenadines by 3 or more Vehicles in Household
In terms of 3 or more vehicles in household, the demographic groups most similar to Immigrants from St. Vincent and the Grenadines are Immigrants from Dominican Republic (10.4%, a difference of 3.7%), Immigrants from Grenada (9.1%, a difference of 10.6%), Dominican (11.2%, a difference of 11.7%), Immigrants from Guyana (11.2%, a difference of 11.8%), and British West Indian (11.4%, a difference of 13.9%).
| Demographics | Rating | Rank | 3 or more Vehicles in Household |
| Immigrants | Cabo Verde | 0.0 /100 | #333 | Tragic 13.6% |
| Immigrants | Ecuador | 0.0 /100 | #334 | Tragic 13.4% |
| Immigrants | Trinidad and Tobago | 0.0 /100 | #335 | Tragic 13.3% |
| Barbadians | 0.0 /100 | #336 | Tragic 12.6% |
| Immigrants | Bangladesh | 0.0 /100 | #337 | Tragic 12.5% |
| Vietnamese | 0.0 /100 | #338 | Tragic 12.5% |
| Immigrants | Uzbekistan | 0.0 /100 | #339 | Tragic 12.0% |
| Immigrants | Barbados | 0.0 /100 | #340 | Tragic 11.7% |
| Guyanese | 0.0 /100 | #341 | Tragic 11.5% |
| British West Indians | 0.0 /100 | #342 | Tragic 11.4% |
| Immigrants | Guyana | 0.0 /100 | #343 | Tragic 11.2% |
| Dominicans | 0.0 /100 | #344 | Tragic 11.2% |
| Immigrants | Dominican Republic | 0.0 /100 | #345 | Tragic 10.4% |
| Immigrants | St. Vincent and the Grenadines | 0.0 /100 | #346 | Tragic 10.1% |
| Immigrants | Grenada | 0.0 /100 | #347 | Tragic 9.1% |
Demographics Similar to Hispanics or Latinos by 3 or more Vehicles in Household
In terms of 3 or more vehicles in household, the demographic groups most similar to Hispanics or Latinos are Immigrants from Laos (22.4%, a difference of 0.030%), Pennsylvania German (22.3%, a difference of 0.16%), Spaniard (22.3%, a difference of 0.29%), Navajo (22.3%, a difference of 0.35%), and Crow (22.5%, a difference of 0.40%).
| Demographics | Rating | Rank | 3 or more Vehicles in Household |
| Scotch-Irish | 100.0 /100 | #49 | Exceptional 22.6% |
| Sioux | 100.0 /100 | #50 | Exceptional 22.6% |
| Whites/Caucasians | 100.0 /100 | #51 | Exceptional 22.6% |
| Welsh | 100.0 /100 | #52 | Exceptional 22.6% |
| Czechs | 100.0 /100 | #53 | Exceptional 22.5% |
| Crow | 100.0 /100 | #54 | Exceptional 22.5% |
| Immigrants | Laos | 100.0 /100 | #55 | Exceptional 22.4% |
| Hispanics or Latinos | 100.0 /100 | #56 | Exceptional 22.4% |
| Pennsylvania Germans | 100.0 /100 | #57 | Exceptional 22.3% |
| Spaniards | 100.0 /100 | #58 | Exceptional 22.3% |
| Navajo | 100.0 /100 | #59 | Exceptional 22.3% |
| Finns | 99.9 /100 | #60 | Exceptional 22.3% |
| Bhutanese | 99.9 /100 | #61 | Exceptional 22.2% |
| Fijians | 99.9 /100 | #62 | Exceptional 22.2% |
| Chickasaw | 99.9 /100 | #63 | Exceptional 22.2% |