Immigrants from Spain vs Norwegian 3rd Grade
COMPARE
Immigrants from Spain
Norwegian
3rd Grade
3rd Grade Comparison
Immigrants from Spain
Norwegians
97.8%
3RD GRADE
54.3/ 100
METRIC RATING
168th/ 347
METRIC RANK
98.6%
3RD GRADE
100.0/ 100
METRIC RATING
7th/ 347
METRIC RANK
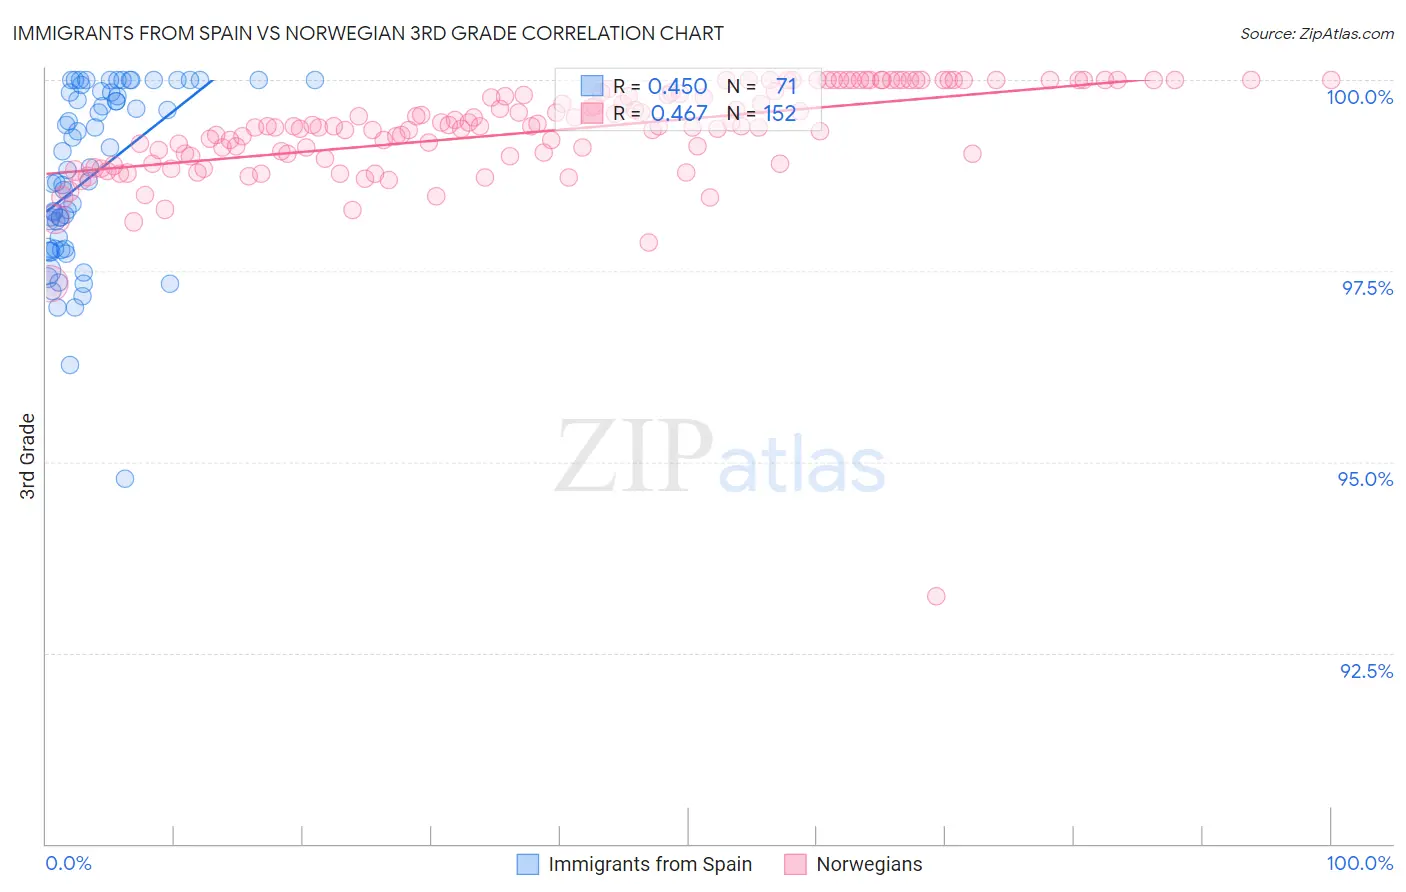
Immigrants from Spain vs Norwegian 3rd Grade Correlation Chart
The statistical analysis conducted on geographies consisting of 239,682,160 people shows a moderate positive correlation between the proportion of Immigrants from Spain and percentage of population with at least 3rd grade education in the United States with a correlation coefficient (R) of 0.450 and weighted average of 97.8%. Similarly, the statistical analysis conducted on geographies consisting of 533,395,488 people shows a moderate positive correlation between the proportion of Norwegians and percentage of population with at least 3rd grade education in the United States with a correlation coefficient (R) of 0.467 and weighted average of 98.6%, a difference of 0.86%.
3rd Grade Correlation Summary
| Measurement | Immigrants from Spain | Norwegian |
| Minimum | 94.8% | 93.2% |
| Maximum | 100.0% | 100.0% |
| Range | 5.2% | 6.8% |
| Mean | 98.8% | 99.3% |
| Median | 98.8% | 99.4% |
| Interquartile 25% (IQ1) | 97.8% | 99.0% |
| Interquartile 75% (IQ3) | 99.8% | 99.8% |
| Interquartile Range (IQR) | 2.1% | 0.83% |
| Standard Deviation (Sample) | 1.1% | 0.73% |
| Standard Deviation (Population) | 1.1% | 0.72% |
Similar Demographics by 3rd Grade
Demographics Similar to Immigrants from Spain by 3rd Grade
In terms of 3rd grade, the demographic groups most similar to Immigrants from Spain are Dutch West Indian (97.8%, a difference of 0.0%), Chilean (97.8%, a difference of 0.0%), Comanche (97.8%, a difference of 0.0%), Brazilian (97.8%, a difference of 0.0%), and Immigrants from Jordan (97.8%, a difference of 0.010%).
| Demographics | Rating | Rank | 3rd Grade |
| Albanians | 58.8 /100 | #161 | Average 97.8% |
| Immigrants | Jordan | 57.9 /100 | #162 | Average 97.8% |
| Marshallese | 57.2 /100 | #163 | Average 97.8% |
| Immigrants | Bosnia and Herzegovina | 56.2 /100 | #164 | Average 97.8% |
| Ugandans | 56.1 /100 | #165 | Average 97.8% |
| Dutch West Indians | 55.5 /100 | #166 | Average 97.8% |
| Chileans | 55.3 /100 | #167 | Average 97.8% |
| Immigrants | Spain | 54.3 /100 | #168 | Average 97.8% |
| Comanche | 53.8 /100 | #169 | Average 97.8% |
| Brazilians | 53.7 /100 | #170 | Average 97.8% |
| Kenyans | 51.8 /100 | #171 | Average 97.8% |
| Spanish Americans | 51.8 /100 | #172 | Average 97.8% |
| Immigrants | Korea | 50.9 /100 | #173 | Average 97.8% |
| Navajo | 50.0 /100 | #174 | Average 97.8% |
| Immigrants | Micronesia | 47.6 /100 | #175 | Average 97.8% |
Demographics Similar to Norwegians by 3rd Grade
In terms of 3rd grade, the demographic groups most similar to Norwegians are Slovak (98.6%, a difference of 0.020%), German (98.6%, a difference of 0.020%), Alaskan Athabascan (98.7%, a difference of 0.040%), Alaska Native (98.6%, a difference of 0.040%), and Slovene (98.6%, a difference of 0.050%).
| Demographics | Rating | Rank | 3rd Grade |
| Crow | 100.0 /100 | #1 | Exceptional 99.6% |
| Yup'ik | 100.0 /100 | #2 | Exceptional 99.0% |
| Welsh | 100.0 /100 | #3 | Exceptional 98.8% |
| Inupiat | 100.0 /100 | #4 | Exceptional 98.8% |
| Tsimshian | 100.0 /100 | #5 | Exceptional 98.8% |
| Alaskan Athabascans | 100.0 /100 | #6 | Exceptional 98.7% |
| Norwegians | 100.0 /100 | #7 | Exceptional 98.6% |
| Slovaks | 100.0 /100 | #8 | Exceptional 98.6% |
| Germans | 100.0 /100 | #9 | Exceptional 98.6% |
| Alaska Natives | 100.0 /100 | #10 | Exceptional 98.6% |
| Slovenes | 100.0 /100 | #11 | Exceptional 98.6% |
| English | 100.0 /100 | #12 | Exceptional 98.6% |
| Tlingit-Haida | 100.0 /100 | #13 | Exceptional 98.5% |
| Carpatho Rusyns | 100.0 /100 | #14 | Exceptional 98.5% |
| Swedes | 100.0 /100 | #15 | Exceptional 98.5% |