Immigrants from South America vs Belizean Male Disability
COMPARE
Immigrants from South America
Belizean
Male Disability
Male Disability Comparison
Immigrants from South America
Belizeans
10.4%
MALE DISABILITY
99.6/ 100
METRIC RATING
57th/ 347
METRIC RANK
11.4%
MALE DISABILITY
21.2/ 100
METRIC RATING
194th/ 347
METRIC RANK
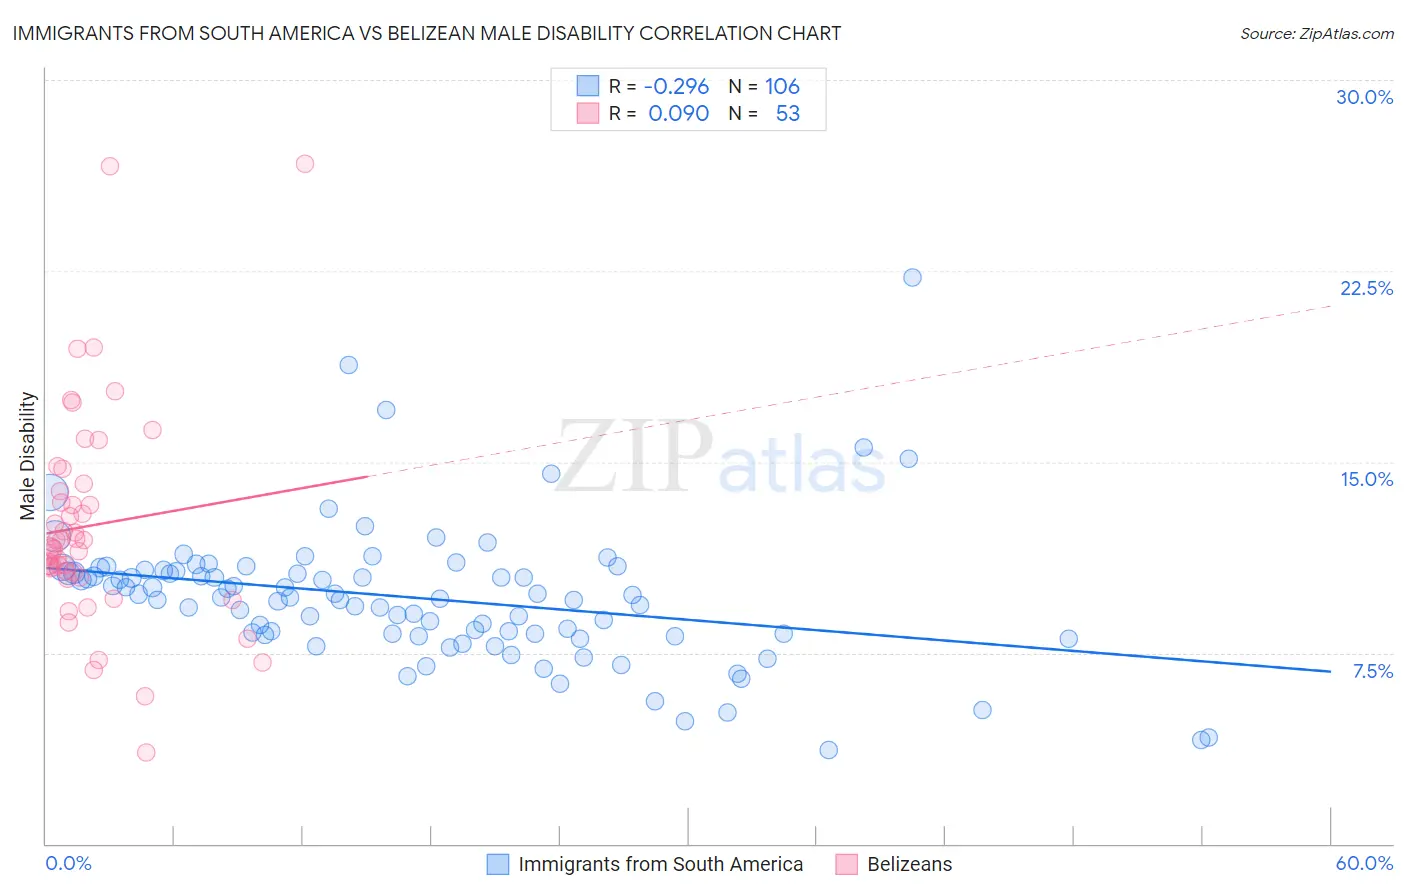
Immigrants from South America vs Belizean Male Disability Correlation Chart
The statistical analysis conducted on geographies consisting of 486,285,750 people shows a weak negative correlation between the proportion of Immigrants from South America and percentage of males with a disability in the United States with a correlation coefficient (R) of -0.296 and weighted average of 10.4%. Similarly, the statistical analysis conducted on geographies consisting of 144,197,719 people shows a slight positive correlation between the proportion of Belizeans and percentage of males with a disability in the United States with a correlation coefficient (R) of 0.090 and weighted average of 11.4%, a difference of 10.1%.
Male Disability Correlation Summary
| Measurement | Immigrants from South America | Belizean |
| Minimum | 3.7% | 3.6% |
| Maximum | 22.2% | 26.7% |
| Range | 18.6% | 23.1% |
| Mean | 9.7% | 12.5% |
| Median | 9.7% | 11.6% |
| Interquartile 25% (IQ1) | 8.3% | 10.6% |
| Interquartile 75% (IQ3) | 10.7% | 14.0% |
| Interquartile Range (IQR) | 2.5% | 3.4% |
| Standard Deviation (Sample) | 2.7% | 4.3% |
| Standard Deviation (Population) | 2.7% | 4.2% |
Similar Demographics by Male Disability
Demographics Similar to Immigrants from South America by Male Disability
In terms of male disability, the demographic groups most similar to Immigrants from South America are Tongan (10.4%, a difference of 0.020%), Immigrants from Eritrea (10.4%, a difference of 0.060%), Immigrants from Japan (10.4%, a difference of 0.070%), Peruvian (10.4%, a difference of 0.080%), and Immigrants from Uzbekistan (10.4%, a difference of 0.12%).
| Demographics | Rating | Rank | Male Disability |
| South Americans | 99.6 /100 | #50 | Exceptional 10.3% |
| Salvadorans | 99.6 /100 | #51 | Exceptional 10.4% |
| Immigrants | Saudi Arabia | 99.6 /100 | #52 | Exceptional 10.4% |
| Immigrants | Uzbekistan | 99.6 /100 | #53 | Exceptional 10.4% |
| Peruvians | 99.6 /100 | #54 | Exceptional 10.4% |
| Immigrants | Eritrea | 99.6 /100 | #55 | Exceptional 10.4% |
| Tongans | 99.6 /100 | #56 | Exceptional 10.4% |
| Immigrants | South America | 99.6 /100 | #57 | Exceptional 10.4% |
| Immigrants | Japan | 99.5 /100 | #58 | Exceptional 10.4% |
| Immigrants | Australia | 99.5 /100 | #59 | Exceptional 10.4% |
| Immigrants | Colombia | 99.5 /100 | #60 | Exceptional 10.4% |
| Immigrants | Northern Africa | 99.4 /100 | #61 | Exceptional 10.4% |
| Immigrants | Ecuador | 99.3 /100 | #62 | Exceptional 10.4% |
| Immigrants | Belarus | 99.3 /100 | #63 | Exceptional 10.4% |
| Jordanians | 99.3 /100 | #64 | Exceptional 10.5% |
Demographics Similar to Belizeans by Male Disability
In terms of male disability, the demographic groups most similar to Belizeans are Immigrants from Oceania (11.4%, a difference of 0.030%), Greek (11.4%, a difference of 0.080%), Assyrian/Chaldean/Syriac (11.4%, a difference of 0.15%), Senegalese (11.4%, a difference of 0.16%), and West Indian (11.4%, a difference of 0.24%).
| Demographics | Rating | Rank | Male Disability |
| Immigrants | Austria | 27.3 /100 | #187 | Fair 11.4% |
| Estonians | 26.8 /100 | #188 | Fair 11.4% |
| Immigrants | Netherlands | 25.9 /100 | #189 | Fair 11.4% |
| Immigrants | Bosnia and Herzegovina | 25.4 /100 | #190 | Fair 11.4% |
| Senegalese | 23.2 /100 | #191 | Fair 11.4% |
| Assyrians/Chaldeans/Syriacs | 23.2 /100 | #192 | Fair 11.4% |
| Greeks | 22.2 /100 | #193 | Fair 11.4% |
| Belizeans | 21.2 /100 | #194 | Fair 11.4% |
| Immigrants | Oceania | 20.9 /100 | #195 | Fair 11.4% |
| West Indians | 18.4 /100 | #196 | Poor 11.4% |
| Somalis | 18.2 /100 | #197 | Poor 11.4% |
| Immigrants | Jamaica | 16.3 /100 | #198 | Poor 11.5% |
| Lebanese | 15.4 /100 | #199 | Poor 11.5% |
| Immigrants | Iraq | 13.0 /100 | #200 | Poor 11.5% |
| Immigrants | Panama | 13.0 /100 | #201 | Poor 11.5% |