Immigrants from Somalia vs Alaskan Athabascan Householder Income Ages 25 - 44 years
COMPARE
Immigrants from Somalia
Alaskan Athabascan
Householder Income Ages 25 - 44 years
Householder Income Ages 25 - 44 years Comparison
Immigrants from Somalia
Alaskan Athabascans
$82,188
HOUSEHOLDER INCOME AGES 25 - 44 YEARS
0.1/ 100
METRIC RATING
285th/ 347
METRIC RANK
$88,446
HOUSEHOLDER INCOME AGES 25 - 44 YEARS
3.3/ 100
METRIC RATING
230th/ 347
METRIC RANK
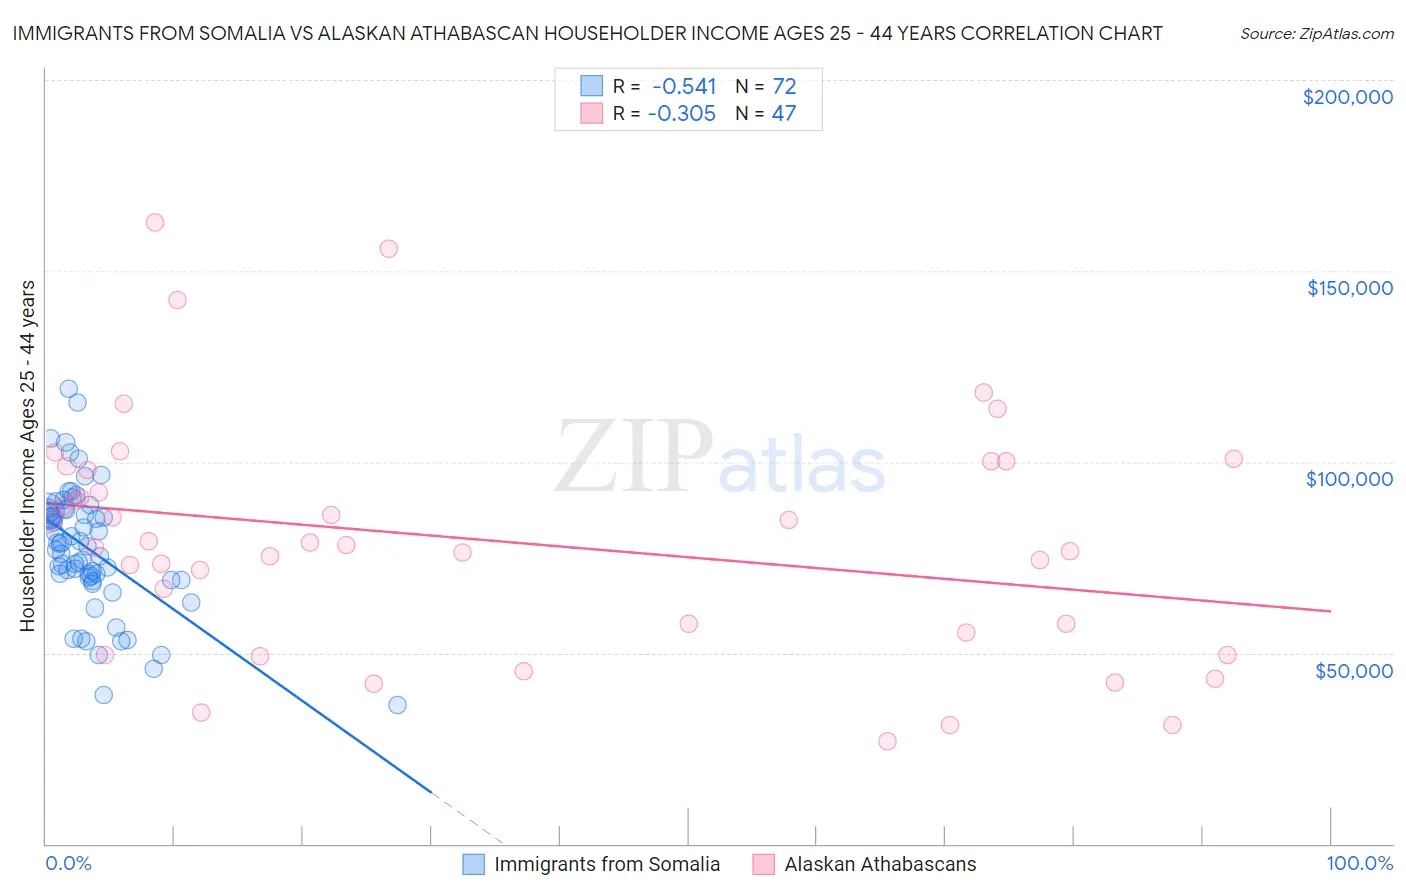
Immigrants from Somalia vs Alaskan Athabascan Householder Income Ages 25 - 44 years Correlation Chart
The statistical analysis conducted on geographies consisting of 92,085,049 people shows a substantial negative correlation between the proportion of Immigrants from Somalia and household income with householder between the ages 25 and 44 in the United States with a correlation coefficient (R) of -0.541 and weighted average of $82,188. Similarly, the statistical analysis conducted on geographies consisting of 45,791,396 people shows a mild negative correlation between the proportion of Alaskan Athabascans and household income with householder between the ages 25 and 44 in the United States with a correlation coefficient (R) of -0.305 and weighted average of $88,446, a difference of 7.6%.
Householder Income Ages 25 - 44 years Correlation Summary
| Measurement | Immigrants from Somalia | Alaskan Athabascan |
| Minimum | $36,409 | $26,875 |
| Maximum | $119,233 | $162,636 |
| Range | $82,824 | $135,761 |
| Mean | $77,251 | $79,344 |
| Median | $78,315 | $78,125 |
| Interquartile 25% (IQ1) | $69,397 | $55,208 |
| Interquartile 75% (IQ3) | $87,226 | $98,910 |
| Interquartile Range (IQR) | $17,829 | $43,702 |
| Standard Deviation (Sample) | $16,543 | $30,855 |
| Standard Deviation (Population) | $16,428 | $30,525 |
Similar Demographics by Householder Income Ages 25 - 44 years
Demographics Similar to Immigrants from Somalia by Householder Income Ages 25 - 44 years
In terms of householder income ages 25 - 44 years, the demographic groups most similar to Immigrants from Somalia are Ute ($82,166, a difference of 0.030%), Immigrants from Latin America ($82,166, a difference of 0.030%), Comanche ($82,152, a difference of 0.040%), Immigrants from Middle Africa ($82,254, a difference of 0.080%), and Shoshone ($82,062, a difference of 0.15%).
| Demographics | Rating | Rank | Householder Income Ages 25 - 44 years |
| Senegalese | 0.2 /100 | #278 | Tragic $82,852 |
| Pima | 0.1 /100 | #279 | Tragic $82,821 |
| Colville | 0.1 /100 | #280 | Tragic $82,604 |
| Cajuns | 0.1 /100 | #281 | Tragic $82,393 |
| Central American Indians | 0.1 /100 | #282 | Tragic $82,355 |
| Guatemalans | 0.1 /100 | #283 | Tragic $82,331 |
| Immigrants | Middle Africa | 0.1 /100 | #284 | Tragic $82,254 |
| Immigrants | Somalia | 0.1 /100 | #285 | Tragic $82,188 |
| Ute | 0.1 /100 | #286 | Tragic $82,166 |
| Immigrants | Latin America | 0.1 /100 | #287 | Tragic $82,166 |
| Comanche | 0.1 /100 | #288 | Tragic $82,152 |
| Shoshone | 0.1 /100 | #289 | Tragic $82,062 |
| Liberians | 0.1 /100 | #290 | Tragic $82,005 |
| Potawatomi | 0.1 /100 | #291 | Tragic $81,774 |
| Yaqui | 0.1 /100 | #292 | Tragic $81,656 |
Demographics Similar to Alaskan Athabascans by Householder Income Ages 25 - 44 years
In terms of householder income ages 25 - 44 years, the demographic groups most similar to Alaskan Athabascans are Immigrants from Grenada ($88,311, a difference of 0.15%), Nonimmigrants ($88,301, a difference of 0.16%), Malaysian ($88,291, a difference of 0.18%), Venezuelan ($88,232, a difference of 0.24%), and Bermudan ($88,231, a difference of 0.24%).
| Demographics | Rating | Rank | Householder Income Ages 25 - 44 years |
| Immigrants | Guyana | 5.9 /100 | #223 | Tragic $89,586 |
| Barbadians | 5.9 /100 | #224 | Tragic $89,565 |
| Immigrants | Panama | 5.5 /100 | #225 | Tragic $89,451 |
| Immigrants | Iraq | 5.5 /100 | #226 | Tragic $89,444 |
| Immigrants | St. Vincent and the Grenadines | 4.1 /100 | #227 | Tragic $88,888 |
| Immigrants | Bosnia and Herzegovina | 4.0 /100 | #228 | Tragic $88,819 |
| Immigrants | Barbados | 3.7 /100 | #229 | Tragic $88,687 |
| Alaskan Athabascans | 3.3 /100 | #230 | Tragic $88,446 |
| Immigrants | Grenada | 3.0 /100 | #231 | Tragic $88,311 |
| Immigrants | Nonimmigrants | 3.0 /100 | #232 | Tragic $88,301 |
| Malaysians | 3.0 /100 | #233 | Tragic $88,291 |
| Venezuelans | 2.9 /100 | #234 | Tragic $88,232 |
| Bermudans | 2.9 /100 | #235 | Tragic $88,231 |
| Immigrants | Cameroon | 2.9 /100 | #236 | Tragic $88,214 |
| Salvadorans | 2.8 /100 | #237 | Tragic $88,198 |