Immigrants from Somalia vs Guamanian/Chamorro No Vehicles in Household
COMPARE
Immigrants from Somalia
Guamanian/Chamorro
No Vehicles in Household
No Vehicles in Household Comparison
Immigrants from Somalia
Guamanians/Chamorros
11.4%
NO VEHICLES IN HOUSEHOLD
5.4/ 100
METRIC RATING
226th/ 347
METRIC RANK
8.0%
NO VEHICLES IN HOUSEHOLD
99.9/ 100
METRIC RATING
49th/ 347
METRIC RANK
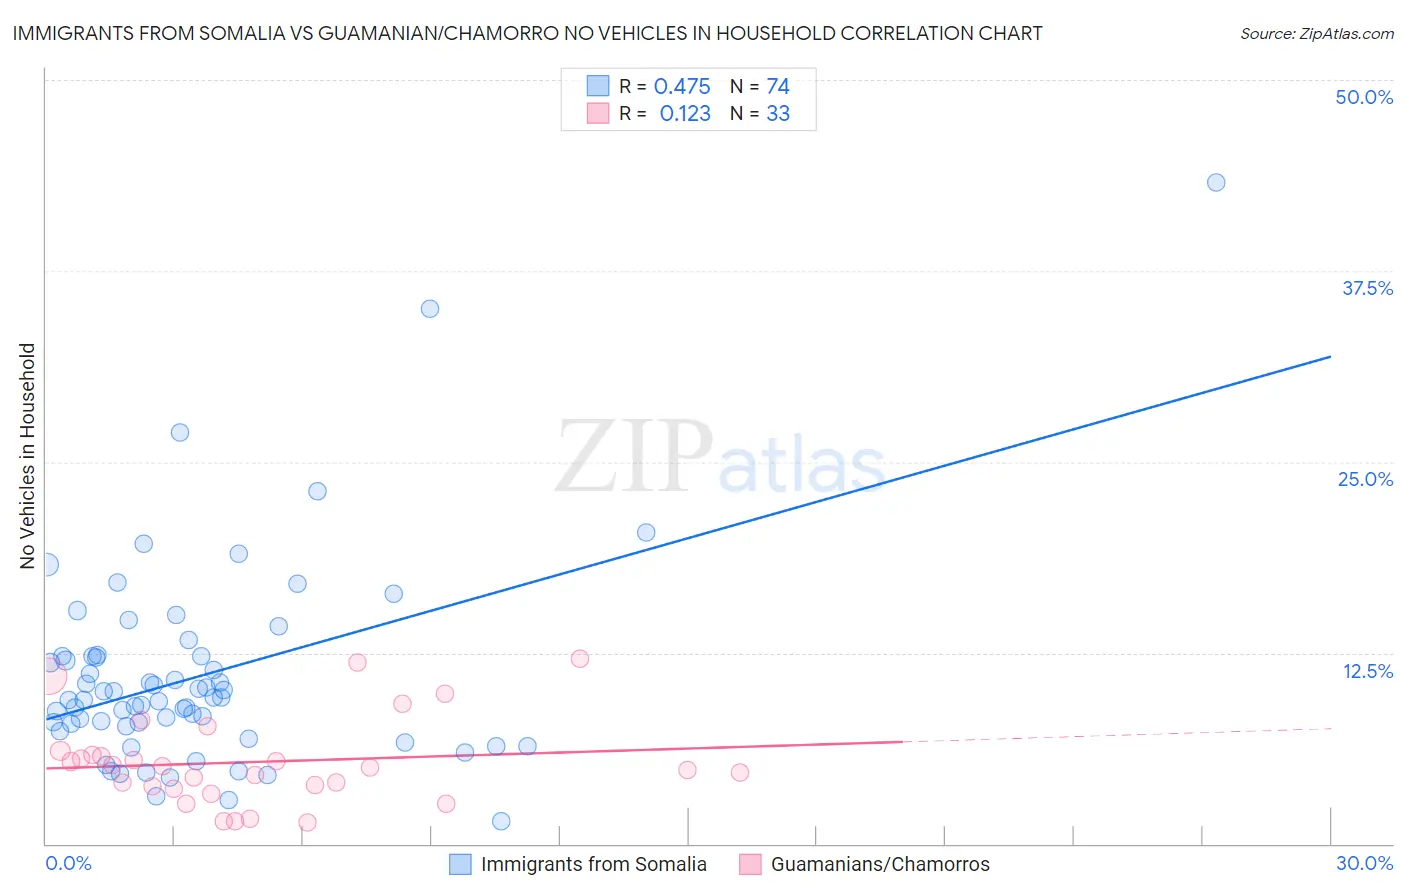
Immigrants from Somalia vs Guamanian/Chamorro No Vehicles in Household Correlation Chart
The statistical analysis conducted on geographies consisting of 92,070,228 people shows a moderate positive correlation between the proportion of Immigrants from Somalia and percentage of households with no vehicle available in the United States with a correlation coefficient (R) of 0.475 and weighted average of 11.4%. Similarly, the statistical analysis conducted on geographies consisting of 221,696,459 people shows a poor positive correlation between the proportion of Guamanians/Chamorros and percentage of households with no vehicle available in the United States with a correlation coefficient (R) of 0.123 and weighted average of 8.0%, a difference of 43.0%.
No Vehicles in Household Correlation Summary
| Measurement | Immigrants from Somalia | Guamanian/Chamorro |
| Minimum | 1.4% | 1.4% |
| Maximum | 43.3% | 12.1% |
| Range | 41.9% | 10.7% |
| Mean | 11.0% | 5.4% |
| Median | 9.5% | 5.0% |
| Interquartile 25% (IQ1) | 7.7% | 3.7% |
| Interquartile 75% (IQ3) | 12.3% | 6.0% |
| Interquartile Range (IQR) | 4.6% | 2.3% |
| Standard Deviation (Sample) | 6.7% | 2.9% |
| Standard Deviation (Population) | 6.6% | 2.8% |
Similar Demographics by No Vehicles in Household
Demographics Similar to Immigrants from Somalia by No Vehicles in Household
In terms of no vehicles in household, the demographic groups most similar to Immigrants from Somalia are Immigrants from Pakistan (11.4%, a difference of 0.020%), Immigrants from Romania (11.4%, a difference of 0.060%), Ugandan (11.4%, a difference of 0.10%), Immigrants from Norway (11.4%, a difference of 0.23%), and Immigrants from Japan (11.4%, a difference of 0.23%).
| Demographics | Rating | Rank | No Vehicles in Household |
| Argentineans | 9.6 /100 | #219 | Tragic 11.2% |
| Immigrants | Zaire | 9.6 /100 | #220 | Tragic 11.2% |
| Peruvians | 8.4 /100 | #221 | Tragic 11.2% |
| Immigrants | South America | 8.0 /100 | #222 | Tragic 11.3% |
| Uruguayans | 7.7 /100 | #223 | Tragic 11.3% |
| Immigrants | Hong Kong | 7.2 /100 | #224 | Tragic 11.3% |
| Immigrants | Sierra Leone | 6.4 /100 | #225 | Tragic 11.3% |
| Immigrants | Somalia | 5.4 /100 | #226 | Tragic 11.4% |
| Immigrants | Pakistan | 5.4 /100 | #227 | Tragic 11.4% |
| Immigrants | Romania | 5.3 /100 | #228 | Tragic 11.4% |
| Ugandans | 5.3 /100 | #229 | Tragic 11.4% |
| Immigrants | Norway | 5.1 /100 | #230 | Tragic 11.4% |
| Immigrants | Japan | 5.1 /100 | #231 | Tragic 11.4% |
| Immigrants | Turkey | 4.8 /100 | #232 | Tragic 11.5% |
| Houma | 4.7 /100 | #233 | Tragic 11.5% |
Demographics Similar to Guamanians/Chamorros by No Vehicles in Household
In terms of no vehicles in household, the demographic groups most similar to Guamanians/Chamorros are Belgian (8.0%, a difference of 0.070%), Afghan (8.0%, a difference of 0.17%), Korean (8.0%, a difference of 0.17%), Northern European (7.9%, a difference of 0.65%), and Hawaiian (8.0%, a difference of 0.75%).
| Demographics | Rating | Rank | No Vehicles in Household |
| Swiss | 99.9 /100 | #42 | Exceptional 7.9% |
| Chickasaw | 99.9 /100 | #43 | Exceptional 7.9% |
| Choctaw | 99.9 /100 | #44 | Exceptional 7.9% |
| Immigrants | Nonimmigrants | 99.9 /100 | #45 | Exceptional 7.9% |
| Spanish | 99.9 /100 | #46 | Exceptional 7.9% |
| Northern Europeans | 99.9 /100 | #47 | Exceptional 7.9% |
| Afghans | 99.9 /100 | #48 | Exceptional 8.0% |
| Guamanians/Chamorros | 99.9 /100 | #49 | Exceptional 8.0% |
| Belgians | 99.9 /100 | #50 | Exceptional 8.0% |
| Koreans | 99.9 /100 | #51 | Exceptional 8.0% |
| Hawaiians | 99.9 /100 | #52 | Exceptional 8.0% |
| Slovenes | 99.9 /100 | #53 | Exceptional 8.0% |
| Immigrants | Venezuela | 99.9 /100 | #54 | Exceptional 8.1% |
| Celtics | 99.9 /100 | #55 | Exceptional 8.1% |
| Immigrants | Afghanistan | 99.9 /100 | #56 | Exceptional 8.1% |