Immigrants from Somalia vs Immigrants from Ukraine No Vehicles in Household
COMPARE
Immigrants from Somalia
Immigrants from Ukraine
No Vehicles in Household
No Vehicles in Household Comparison
Immigrants from Somalia
Immigrants from Ukraine
11.4%
NO VEHICLES IN HOUSEHOLD
5.4/ 100
METRIC RATING
226th/ 347
METRIC RANK
14.9%
NO VEHICLES IN HOUSEHOLD
0.0/ 100
METRIC RATING
301st/ 347
METRIC RANK
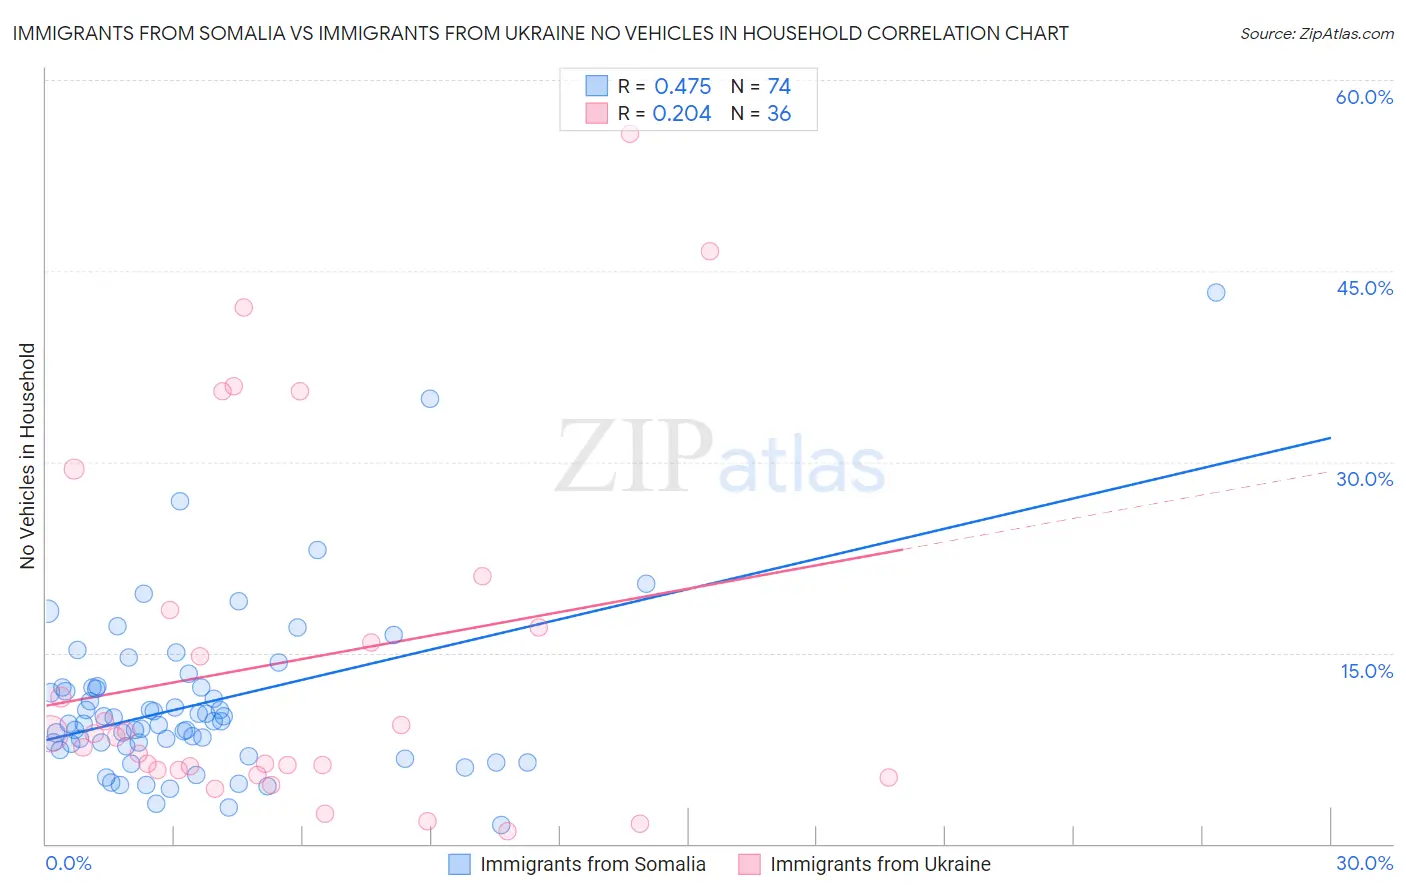
Immigrants from Somalia vs Immigrants from Ukraine No Vehicles in Household Correlation Chart
The statistical analysis conducted on geographies consisting of 92,070,228 people shows a moderate positive correlation between the proportion of Immigrants from Somalia and percentage of households with no vehicle available in the United States with a correlation coefficient (R) of 0.475 and weighted average of 11.4%. Similarly, the statistical analysis conducted on geographies consisting of 289,279,042 people shows a weak positive correlation between the proportion of Immigrants from Ukraine and percentage of households with no vehicle available in the United States with a correlation coefficient (R) of 0.204 and weighted average of 14.9%, a difference of 30.1%.
No Vehicles in Household Correlation Summary
| Measurement | Immigrants from Somalia | Immigrants from Ukraine |
| Minimum | 1.4% | 1.0% |
| Maximum | 43.3% | 55.8% |
| Range | 41.9% | 54.7% |
| Mean | 11.0% | 14.3% |
| Median | 9.5% | 8.5% |
| Interquartile 25% (IQ1) | 7.7% | 5.8% |
| Interquartile 75% (IQ3) | 12.3% | 17.6% |
| Interquartile Range (IQR) | 4.6% | 11.8% |
| Standard Deviation (Sample) | 6.7% | 14.1% |
| Standard Deviation (Population) | 6.6% | 13.9% |
Similar Demographics by No Vehicles in Household
Demographics Similar to Immigrants from Somalia by No Vehicles in Household
In terms of no vehicles in household, the demographic groups most similar to Immigrants from Somalia are Immigrants from Pakistan (11.4%, a difference of 0.020%), Immigrants from Romania (11.4%, a difference of 0.060%), Ugandan (11.4%, a difference of 0.10%), Immigrants from Norway (11.4%, a difference of 0.23%), and Immigrants from Japan (11.4%, a difference of 0.23%).
| Demographics | Rating | Rank | No Vehicles in Household |
| Argentineans | 9.6 /100 | #219 | Tragic 11.2% |
| Immigrants | Zaire | 9.6 /100 | #220 | Tragic 11.2% |
| Peruvians | 8.4 /100 | #221 | Tragic 11.2% |
| Immigrants | South America | 8.0 /100 | #222 | Tragic 11.3% |
| Uruguayans | 7.7 /100 | #223 | Tragic 11.3% |
| Immigrants | Hong Kong | 7.2 /100 | #224 | Tragic 11.3% |
| Immigrants | Sierra Leone | 6.4 /100 | #225 | Tragic 11.3% |
| Immigrants | Somalia | 5.4 /100 | #226 | Tragic 11.4% |
| Immigrants | Pakistan | 5.4 /100 | #227 | Tragic 11.4% |
| Immigrants | Romania | 5.3 /100 | #228 | Tragic 11.4% |
| Ugandans | 5.3 /100 | #229 | Tragic 11.4% |
| Immigrants | Norway | 5.1 /100 | #230 | Tragic 11.4% |
| Immigrants | Japan | 5.1 /100 | #231 | Tragic 11.4% |
| Immigrants | Turkey | 4.8 /100 | #232 | Tragic 11.5% |
| Houma | 4.7 /100 | #233 | Tragic 11.5% |
Demographics Similar to Immigrants from Ukraine by No Vehicles in Household
In terms of no vehicles in household, the demographic groups most similar to Immigrants from Ukraine are Yuman (14.9%, a difference of 0.0%), Haitian (14.9%, a difference of 0.47%), Immigrants from Western Africa (15.0%, a difference of 0.99%), Immigrants from Greece (14.7%, a difference of 1.1%), and Moroccan (14.7%, a difference of 1.3%).
| Demographics | Rating | Rank | No Vehicles in Household |
| Belizeans | 0.0 /100 | #294 | Tragic 14.3% |
| Paraguayans | 0.0 /100 | #295 | Tragic 14.4% |
| Immigrants | Spain | 0.0 /100 | #296 | Tragic 14.5% |
| Immigrants | Panama | 0.0 /100 | #297 | Tragic 14.6% |
| Moroccans | 0.0 /100 | #298 | Tragic 14.7% |
| Immigrants | Greece | 0.0 /100 | #299 | Tragic 14.7% |
| Yuman | 0.0 /100 | #300 | Tragic 14.9% |
| Immigrants | Ukraine | 0.0 /100 | #301 | Tragic 14.9% |
| Haitians | 0.0 /100 | #302 | Tragic 14.9% |
| Immigrants | Western Africa | 0.0 /100 | #303 | Tragic 15.0% |
| Immigrants | Russia | 0.0 /100 | #304 | Tragic 15.1% |
| Immigrants | China | 0.0 /100 | #305 | Tragic 15.2% |
| Immigrants | Belize | 0.0 /100 | #306 | Tragic 15.4% |
| Immigrants | Haiti | 0.0 /100 | #307 | Tragic 15.4% |
| U.S. Virgin Islanders | 0.0 /100 | #308 | Tragic 15.4% |