Immigrants from Sierra Leone vs Creek 4 or more Vehicles in Household
COMPARE
Immigrants from Sierra Leone
Creek
4 or more Vehicles in Household
4 or more Vehicles in Household Comparison
Immigrants from Sierra Leone
Creek
6.1%
4 OR MORE VEHICLES IN HOUSEHOLD
20.5/ 100
METRIC RATING
203rd/ 347
METRIC RANK
7.2%
4 OR MORE VEHICLES IN HOUSEHOLD
99.6/ 100
METRIC RATING
90th/ 347
METRIC RANK
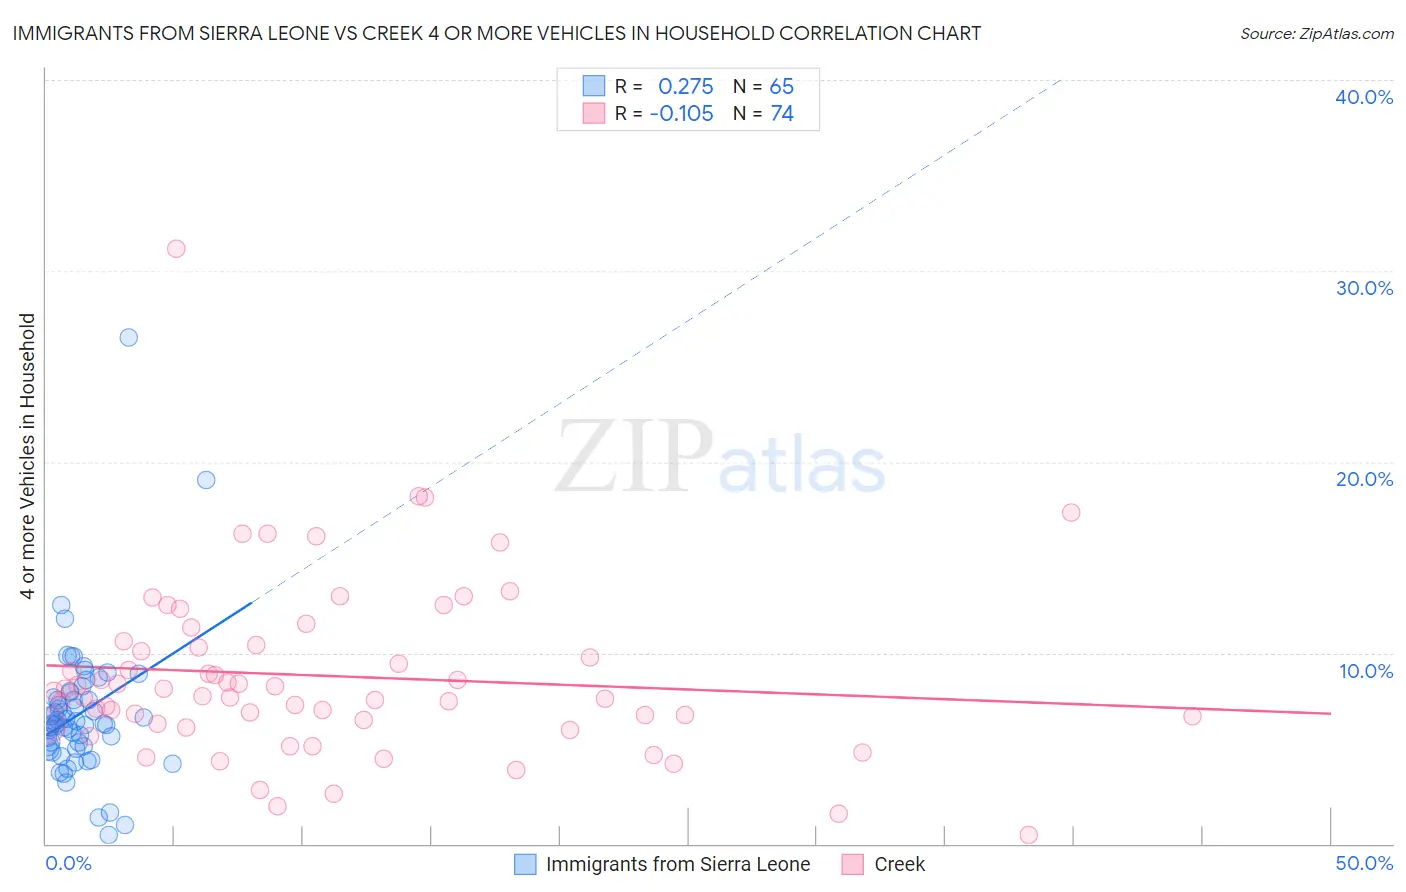
Immigrants from Sierra Leone vs Creek 4 or more Vehicles in Household Correlation Chart
The statistical analysis conducted on geographies consisting of 101,342,659 people shows a weak positive correlation between the proportion of Immigrants from Sierra Leone and percentage of households with 4 or more vehicles available in the United States with a correlation coefficient (R) of 0.275 and weighted average of 6.1%. Similarly, the statistical analysis conducted on geographies consisting of 178,228,664 people shows a poor negative correlation between the proportion of Creek and percentage of households with 4 or more vehicles available in the United States with a correlation coefficient (R) of -0.105 and weighted average of 7.2%, a difference of 17.7%.
4 or more Vehicles in Household Correlation Summary
| Measurement | Immigrants from Sierra Leone | Creek |
| Minimum | 0.48% | 0.43% |
| Maximum | 26.5% | 31.1% |
| Range | 26.0% | 30.7% |
| Mean | 6.8% | 8.8% |
| Median | 6.3% | 7.9% |
| Interquartile 25% (IQ1) | 5.0% | 6.3% |
| Interquartile 75% (IQ3) | 7.8% | 10.4% |
| Interquartile Range (IQR) | 2.7% | 4.2% |
| Standard Deviation (Sample) | 3.7% | 4.7% |
| Standard Deviation (Population) | 3.7% | 4.6% |
Similar Demographics by 4 or more Vehicles in Household
Demographics Similar to Immigrants from Sierra Leone by 4 or more Vehicles in Household
In terms of 4 or more vehicles in household, the demographic groups most similar to Immigrants from Sierra Leone are Immigrants from Belize (6.1%, a difference of 0.10%), Immigrants from South Central Asia (6.1%, a difference of 0.14%), Egyptian (6.1%, a difference of 0.15%), Honduran (6.1%, a difference of 0.19%), and Immigrants from Norway (6.1%, a difference of 0.20%).
| Demographics | Rating | Rank | 4 or more Vehicles in Household |
| Tsimshian | 26.4 /100 | #196 | Fair 6.2% |
| Immigrants | Sri Lanka | 23.7 /100 | #197 | Fair 6.1% |
| Immigrants | Portugal | 22.3 /100 | #198 | Fair 6.1% |
| Immigrants | Norway | 21.8 /100 | #199 | Fair 6.1% |
| Latvians | 21.7 /100 | #200 | Fair 6.1% |
| Egyptians | 21.4 /100 | #201 | Fair 6.1% |
| Immigrants | South Central Asia | 21.3 /100 | #202 | Fair 6.1% |
| Immigrants | Sierra Leone | 20.5 /100 | #203 | Fair 6.1% |
| Immigrants | Belize | 19.8 /100 | #204 | Poor 6.1% |
| Hondurans | 19.3 /100 | #205 | Poor 6.1% |
| Kenyans | 18.5 /100 | #206 | Poor 6.1% |
| Immigrants | Chile | 16.9 /100 | #207 | Poor 6.1% |
| Immigrants | Nigeria | 15.6 /100 | #208 | Poor 6.1% |
| Immigrants | Honduras | 15.4 /100 | #209 | Poor 6.1% |
| Immigrants | Zimbabwe | 15.1 /100 | #210 | Poor 6.0% |
Demographics Similar to Creek by 4 or more Vehicles in Household
In terms of 4 or more vehicles in household, the demographic groups most similar to Creek are British (7.2%, a difference of 0.080%), Nonimmigrants (7.2%, a difference of 0.41%), Delaware (7.2%, a difference of 0.44%), Immigrants from Indonesia (7.2%, a difference of 0.50%), and Assyrian/Chaldean/Syriac (7.2%, a difference of 0.56%).
| Demographics | Rating | Rank | 4 or more Vehicles in Household |
| Potawatomi | 99.7 /100 | #83 | Exceptional 7.3% |
| Afghans | 99.7 /100 | #84 | Exceptional 7.3% |
| Cree | 99.7 /100 | #85 | Exceptional 7.2% |
| Immigrants | Indonesia | 99.6 /100 | #86 | Exceptional 7.2% |
| Delaware | 99.6 /100 | #87 | Exceptional 7.2% |
| Immigrants | Nonimmigrants | 99.6 /100 | #88 | Exceptional 7.2% |
| British | 99.6 /100 | #89 | Exceptional 7.2% |
| Creek | 99.6 /100 | #90 | Exceptional 7.2% |
| Assyrians/Chaldeans/Syriacs | 99.4 /100 | #91 | Exceptional 7.2% |
| Immigrants | Latin America | 99.4 /100 | #92 | Exceptional 7.1% |
| Immigrants | Afghanistan | 99.3 /100 | #93 | Exceptional 7.1% |
| Dutch West Indians | 99.3 /100 | #94 | Exceptional 7.1% |
| Czechoslovakians | 99.3 /100 | #95 | Exceptional 7.1% |
| Central Americans | 99.3 /100 | #96 | Exceptional 7.1% |
| Celtics | 99.1 /100 | #97 | Exceptional 7.1% |