Fijian vs Immigrants from Uganda 2 or more Vehicles in Household
COMPARE
Fijian
Immigrants from Uganda
2 or more Vehicles in Household
2 or more Vehicles in Household Comparison
Fijians
Immigrants from Uganda
57.6%
2 OR MORE VEHICLES IN HOUSEHOLD
98.4/ 100
METRIC RATING
100th/ 347
METRIC RANK
55.0%
2 OR MORE VEHICLES IN HOUSEHOLD
33.4/ 100
METRIC RATING
187th/ 347
METRIC RANK
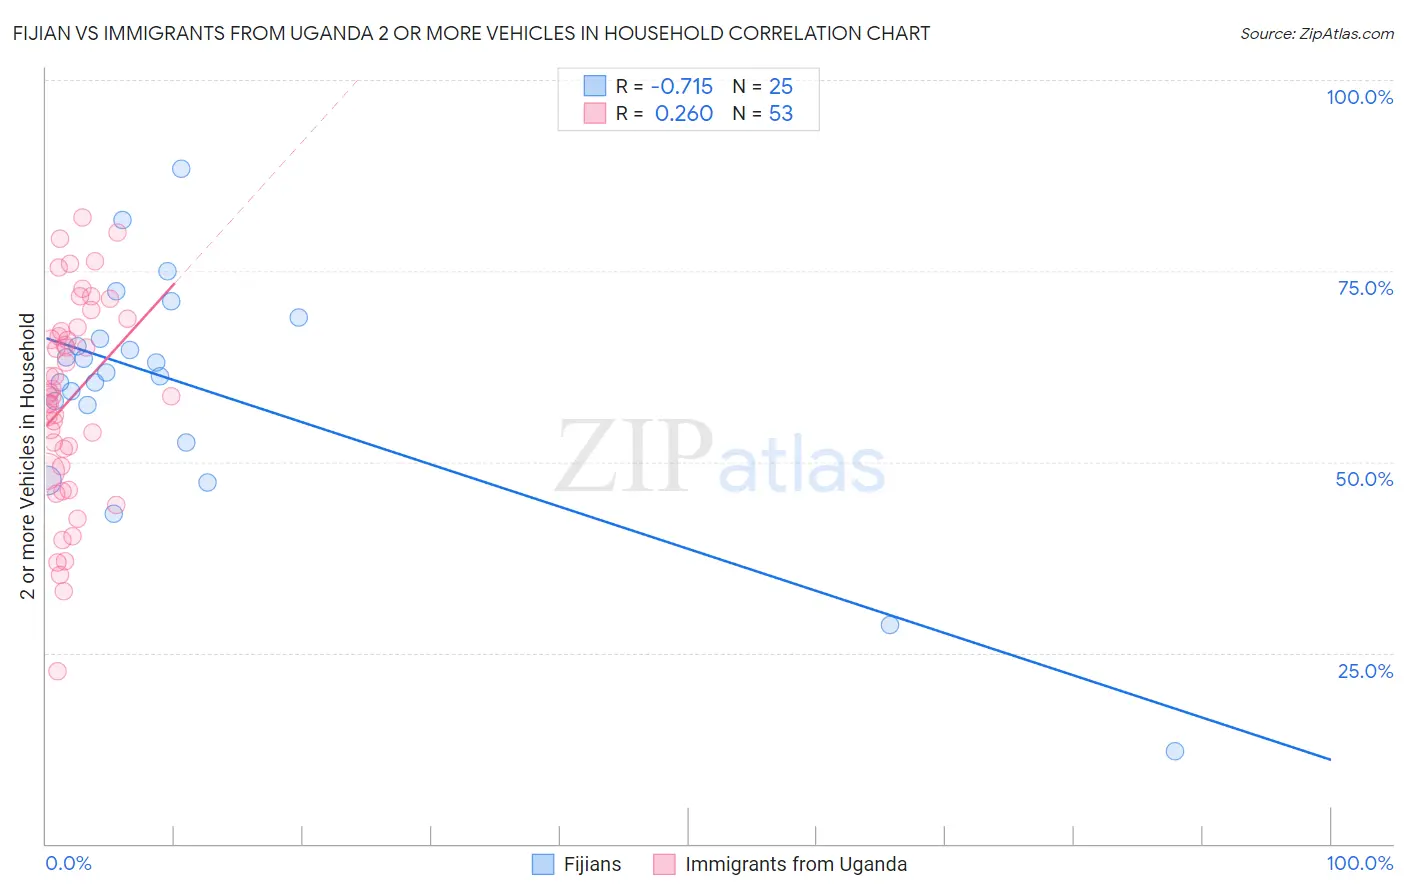
Fijian vs Immigrants from Uganda 2 or more Vehicles in Household Correlation Chart
The statistical analysis conducted on geographies consisting of 55,948,040 people shows a strong negative correlation between the proportion of Fijians and percentage of households with 2 or more vehicles available in the United States with a correlation coefficient (R) of -0.715 and weighted average of 57.6%. Similarly, the statistical analysis conducted on geographies consisting of 125,974,533 people shows a weak positive correlation between the proportion of Immigrants from Uganda and percentage of households with 2 or more vehicles available in the United States with a correlation coefficient (R) of 0.260 and weighted average of 55.0%, a difference of 4.8%.
2 or more Vehicles in Household Correlation Summary
| Measurement | Fijian | Immigrants from Uganda |
| Minimum | 12.2% | 22.5% |
| Maximum | 88.4% | 82.0% |
| Range | 76.3% | 59.5% |
| Mean | 59.7% | 58.2% |
| Median | 61.6% | 58.8% |
| Interquartile 25% (IQ1) | 54.9% | 49.1% |
| Interquartile 75% (IQ3) | 67.6% | 67.3% |
| Interquartile Range (IQR) | 12.6% | 18.2% |
| Standard Deviation (Sample) | 15.7% | 13.3% |
| Standard Deviation (Population) | 15.4% | 13.2% |
Similar Demographics by 2 or more Vehicles in Household
Demographics Similar to Fijians by 2 or more Vehicles in Household
In terms of 2 or more vehicles in household, the demographic groups most similar to Fijians are Lebanese (57.6%, a difference of 0.050%), Cajun (57.7%, a difference of 0.070%), Immigrants from Bolivia (57.6%, a difference of 0.090%), Jordanian (57.6%, a difference of 0.10%), and Immigrants from Indonesia (57.6%, a difference of 0.10%).
| Demographics | Rating | Rank | 2 or more Vehicles in Household |
| Ottawa | 99.0 /100 | #93 | Exceptional 57.9% |
| Filipinos | 98.9 /100 | #94 | Exceptional 57.8% |
| Hmong | 98.9 /100 | #95 | Exceptional 57.8% |
| Burmese | 98.8 /100 | #96 | Exceptional 57.8% |
| Slavs | 98.8 /100 | #97 | Exceptional 57.8% |
| Palestinians | 98.6 /100 | #98 | Exceptional 57.7% |
| Cajuns | 98.5 /100 | #99 | Exceptional 57.7% |
| Fijians | 98.4 /100 | #100 | Exceptional 57.6% |
| Lebanese | 98.3 /100 | #101 | Exceptional 57.6% |
| Immigrants | Bolivia | 98.2 /100 | #102 | Exceptional 57.6% |
| Jordanians | 98.2 /100 | #103 | Exceptional 57.6% |
| Immigrants | Indonesia | 98.2 /100 | #104 | Exceptional 57.6% |
| Immigrants | Korea | 98.2 /100 | #105 | Exceptional 57.6% |
| Immigrants | Oceania | 98.2 /100 | #106 | Exceptional 57.5% |
| Immigrants | Netherlands | 98.2 /100 | #107 | Exceptional 57.5% |
Demographics Similar to Immigrants from Uganda by 2 or more Vehicles in Household
In terms of 2 or more vehicles in household, the demographic groups most similar to Immigrants from Uganda are Peruvian (55.0%, a difference of 0.010%), Arab (55.0%, a difference of 0.11%), Marshallese (54.9%, a difference of 0.13%), Apache (55.1%, a difference of 0.15%), and Immigrants from Cameroon (55.1%, a difference of 0.17%).
| Demographics | Rating | Rank | 2 or more Vehicles in Household |
| Immigrants | Kenya | 40.4 /100 | #180 | Average 55.1% |
| Immigrants | Micronesia | 38.2 /100 | #181 | Fair 55.1% |
| Cree | 38.2 /100 | #182 | Fair 55.1% |
| Immigrants | Cameroon | 37.3 /100 | #183 | Fair 55.1% |
| Apache | 36.7 /100 | #184 | Fair 55.1% |
| Arabs | 35.9 /100 | #185 | Fair 55.0% |
| Peruvians | 33.7 /100 | #186 | Fair 55.0% |
| Immigrants | Uganda | 33.4 /100 | #187 | Fair 55.0% |
| Marshallese | 30.5 /100 | #188 | Fair 54.9% |
| Eastern Europeans | 27.5 /100 | #189 | Fair 54.8% |
| Russians | 26.3 /100 | #190 | Fair 54.8% |
| Immigrants | Immigrants | 25.0 /100 | #191 | Fair 54.7% |
| Immigrants | Romania | 23.8 /100 | #192 | Fair 54.7% |
| Immigrants | Japan | 23.4 /100 | #193 | Fair 54.7% |
| Central Americans | 23.0 /100 | #194 | Fair 54.7% |