Immigrants from Argentina vs Immigrants from Uganda 2 or more Vehicles in Household
COMPARE
Immigrants from Argentina
Immigrants from Uganda
2 or more Vehicles in Household
2 or more Vehicles in Household Comparison
Immigrants from Argentina
Immigrants from Uganda
53.9%
2 OR MORE VEHICLES IN HOUSEHOLD
6.8/ 100
METRIC RATING
218th/ 347
METRIC RANK
55.0%
2 OR MORE VEHICLES IN HOUSEHOLD
33.4/ 100
METRIC RATING
187th/ 347
METRIC RANK
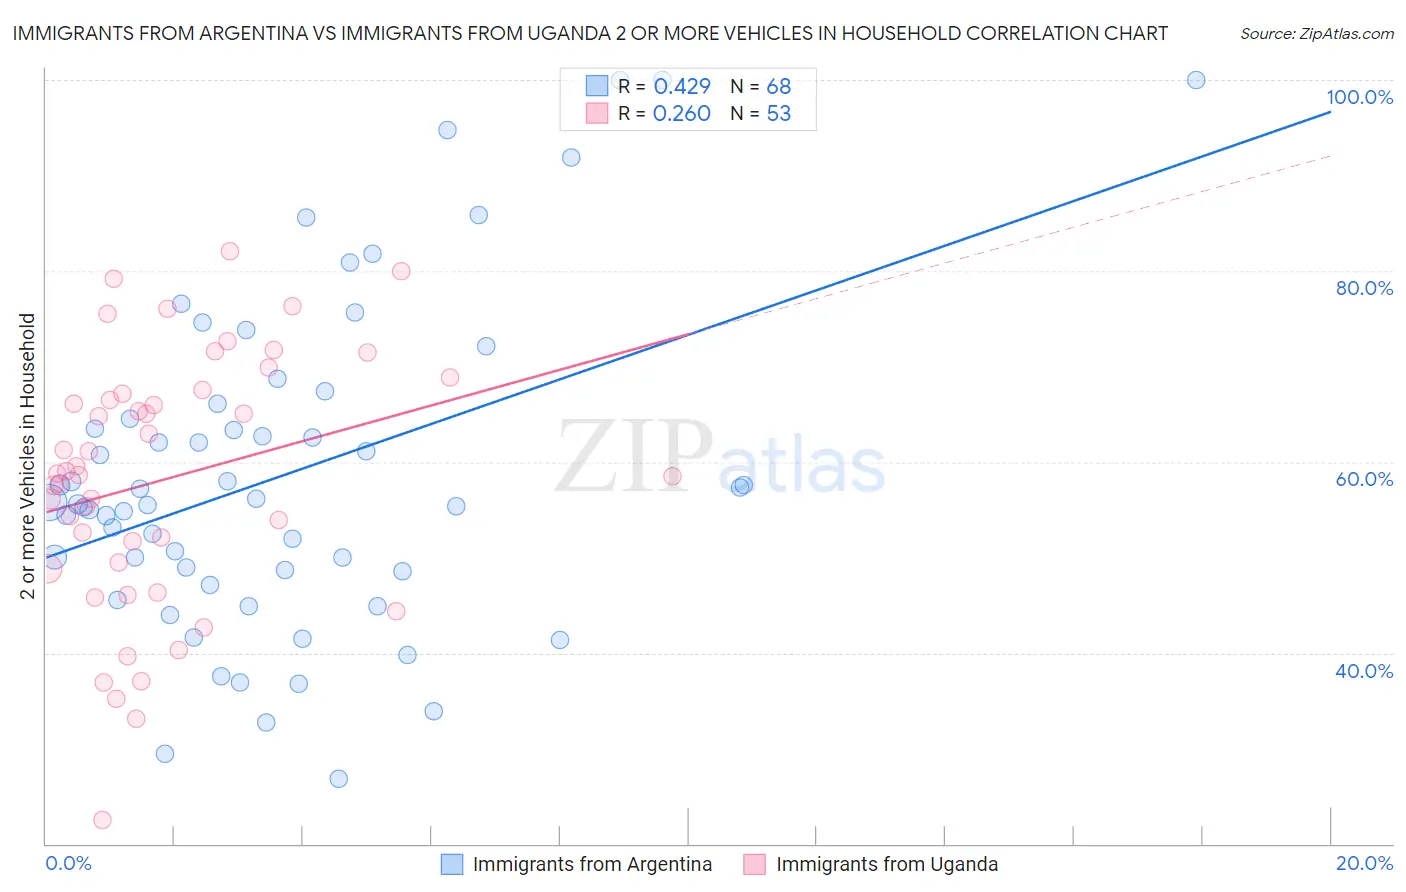
Immigrants from Argentina vs Immigrants from Uganda 2 or more Vehicles in Household Correlation Chart
The statistical analysis conducted on geographies consisting of 264,362,205 people shows a moderate positive correlation between the proportion of Immigrants from Argentina and percentage of households with 2 or more vehicles available in the United States with a correlation coefficient (R) of 0.429 and weighted average of 53.9%. Similarly, the statistical analysis conducted on geographies consisting of 125,974,533 people shows a weak positive correlation between the proportion of Immigrants from Uganda and percentage of households with 2 or more vehicles available in the United States with a correlation coefficient (R) of 0.260 and weighted average of 55.0%, a difference of 2.0%.
2 or more Vehicles in Household Correlation Summary
| Measurement | Immigrants from Argentina | Immigrants from Uganda |
| Minimum | 26.8% | 22.5% |
| Maximum | 100.0% | 82.0% |
| Range | 73.2% | 59.5% |
| Mean | 58.6% | 58.2% |
| Median | 55.6% | 58.8% |
| Interquartile 25% (IQ1) | 48.6% | 49.1% |
| Interquartile 75% (IQ3) | 65.3% | 67.3% |
| Interquartile Range (IQR) | 16.6% | 18.2% |
| Standard Deviation (Sample) | 16.9% | 13.3% |
| Standard Deviation (Population) | 16.8% | 13.2% |
Similar Demographics by 2 or more Vehicles in Household
Demographics Similar to Immigrants from Argentina by 2 or more Vehicles in Household
In terms of 2 or more vehicles in household, the demographic groups most similar to Immigrants from Argentina are Immigrants from Burma/Myanmar (53.9%, a difference of 0.050%), South American Indian (53.9%, a difference of 0.060%), Taiwanese (53.9%, a difference of 0.080%), Immigrants from Singapore (53.9%, a difference of 0.10%), and Kiowa (53.9%, a difference of 0.11%).
| Demographics | Rating | Rank | 2 or more Vehicles in Household |
| Immigrants | Hungary | 11.3 /100 | #211 | Poor 54.2% |
| Immigrants | Chile | 11.1 /100 | #212 | Poor 54.2% |
| Guatemalans | 9.6 /100 | #213 | Tragic 54.1% |
| Immigrants | Czechoslovakia | 9.4 /100 | #214 | Tragic 54.1% |
| Aleuts | 9.3 /100 | #215 | Tragic 54.1% |
| Immigrants | Western Asia | 9.3 /100 | #216 | Tragic 54.1% |
| Immigrants | Burma/Myanmar | 7.1 /100 | #217 | Tragic 53.9% |
| Immigrants | Argentina | 6.8 /100 | #218 | Tragic 53.9% |
| South American Indians | 6.5 /100 | #219 | Tragic 53.9% |
| Taiwanese | 6.3 /100 | #220 | Tragic 53.9% |
| Immigrants | Singapore | 6.3 /100 | #221 | Tragic 53.9% |
| Kiowa | 6.2 /100 | #222 | Tragic 53.9% |
| Immigrants | Bosnia and Herzegovina | 5.5 /100 | #223 | Tragic 53.8% |
| Brazilians | 5.3 /100 | #224 | Tragic 53.8% |
| Immigrants | Egypt | 5.2 /100 | #225 | Tragic 53.8% |
Demographics Similar to Immigrants from Uganda by 2 or more Vehicles in Household
In terms of 2 or more vehicles in household, the demographic groups most similar to Immigrants from Uganda are Peruvian (55.0%, a difference of 0.010%), Arab (55.0%, a difference of 0.11%), Marshallese (54.9%, a difference of 0.13%), Apache (55.1%, a difference of 0.15%), and Immigrants from Cameroon (55.1%, a difference of 0.17%).
| Demographics | Rating | Rank | 2 or more Vehicles in Household |
| Immigrants | Kenya | 40.4 /100 | #180 | Average 55.1% |
| Immigrants | Micronesia | 38.2 /100 | #181 | Fair 55.1% |
| Cree | 38.2 /100 | #182 | Fair 55.1% |
| Immigrants | Cameroon | 37.3 /100 | #183 | Fair 55.1% |
| Apache | 36.7 /100 | #184 | Fair 55.1% |
| Arabs | 35.9 /100 | #185 | Fair 55.0% |
| Peruvians | 33.7 /100 | #186 | Fair 55.0% |
| Immigrants | Uganda | 33.4 /100 | #187 | Fair 55.0% |
| Marshallese | 30.5 /100 | #188 | Fair 54.9% |
| Eastern Europeans | 27.5 /100 | #189 | Fair 54.8% |
| Russians | 26.3 /100 | #190 | Fair 54.8% |
| Immigrants | Immigrants | 25.0 /100 | #191 | Fair 54.7% |
| Immigrants | Romania | 23.8 /100 | #192 | Fair 54.7% |
| Immigrants | Japan | 23.4 /100 | #193 | Fair 54.7% |
| Central Americans | 23.0 /100 | #194 | Fair 54.7% |