Immigrants from Panama vs Immigrants from South Central Asia 2 or more Vehicles in Household
COMPARE
Immigrants from Panama
Immigrants from South Central Asia
2 or more Vehicles in Household
2 or more Vehicles in Household Comparison
Immigrants from Panama
Immigrants from South Central Asia
51.1%
2 OR MORE VEHICLES IN HOUSEHOLD
0.0/ 100
METRIC RATING
290th/ 347
METRIC RANK
56.6%
2 OR MORE VEHICLES IN HOUSEHOLD
90.5/ 100
METRIC RATING
128th/ 347
METRIC RANK
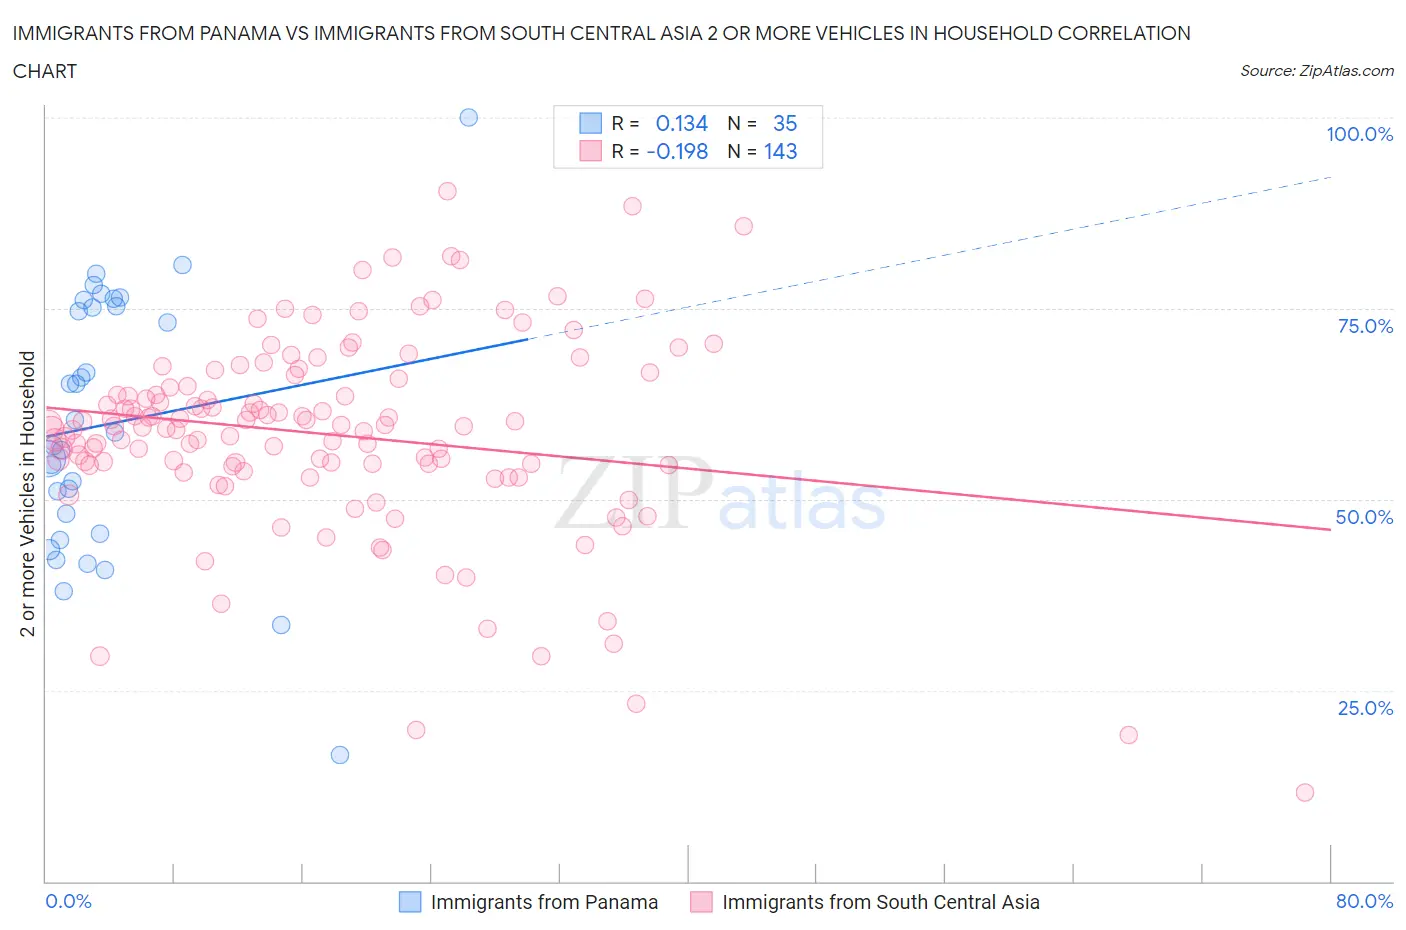
Immigrants from Panama vs Immigrants from South Central Asia 2 or more Vehicles in Household Correlation Chart
The statistical analysis conducted on geographies consisting of 221,156,465 people shows a poor positive correlation between the proportion of Immigrants from Panama and percentage of households with 2 or more vehicles available in the United States with a correlation coefficient (R) of 0.134 and weighted average of 51.1%. Similarly, the statistical analysis conducted on geographies consisting of 472,708,525 people shows a poor negative correlation between the proportion of Immigrants from South Central Asia and percentage of households with 2 or more vehicles available in the United States with a correlation coefficient (R) of -0.198 and weighted average of 56.6%, a difference of 10.8%.
2 or more Vehicles in Household Correlation Summary
| Measurement | Immigrants from Panama | Immigrants from South Central Asia |
| Minimum | 16.5% | 11.6% |
| Maximum | 100.0% | 90.3% |
| Range | 83.5% | 78.7% |
| Mean | 59.9% | 58.5% |
| Median | 58.8% | 59.5% |
| Interquartile 25% (IQ1) | 45.5% | 54.4% |
| Interquartile 75% (IQ3) | 75.3% | 64.8% |
| Interquartile Range (IQR) | 29.8% | 10.4% |
| Standard Deviation (Sample) | 17.2% | 12.9% |
| Standard Deviation (Population) | 16.9% | 12.9% |
Similar Demographics by 2 or more Vehicles in Household
Demographics Similar to Immigrants from Panama by 2 or more Vehicles in Household
In terms of 2 or more vehicles in household, the demographic groups most similar to Immigrants from Panama are Belizean (51.0%, a difference of 0.030%), Somali (51.1%, a difference of 0.060%), Okinawan (51.2%, a difference of 0.35%), Immigrants from Ukraine (50.9%, a difference of 0.36%), and Black/African American (50.9%, a difference of 0.37%).
| Demographics | Rating | Rank | 2 or more Vehicles in Household |
| Immigrants | China | 0.1 /100 | #283 | Tragic 51.5% |
| Immigrants | Zaire | 0.1 /100 | #284 | Tragic 51.5% |
| Immigrants | Uruguay | 0.1 /100 | #285 | Tragic 51.4% |
| Immigrants | Liberia | 0.1 /100 | #286 | Tragic 51.3% |
| Immigrants | Serbia | 0.1 /100 | #287 | Tragic 51.3% |
| Okinawans | 0.1 /100 | #288 | Tragic 51.2% |
| Somalis | 0.0 /100 | #289 | Tragic 51.1% |
| Immigrants | Panama | 0.0 /100 | #290 | Tragic 51.1% |
| Belizeans | 0.0 /100 | #291 | Tragic 51.0% |
| Immigrants | Ukraine | 0.0 /100 | #292 | Tragic 50.9% |
| Blacks/African Americans | 0.0 /100 | #293 | Tragic 50.9% |
| Bermudans | 0.0 /100 | #294 | Tragic 50.6% |
| Cypriots | 0.0 /100 | #295 | Tragic 50.6% |
| Immigrants | Somalia | 0.0 /100 | #296 | Tragic 50.5% |
| Immigrants | Spain | 0.0 /100 | #297 | Tragic 50.4% |
Demographics Similar to Immigrants from South Central Asia by 2 or more Vehicles in Household
In terms of 2 or more vehicles in household, the demographic groups most similar to Immigrants from South Central Asia are Immigrants from Thailand (56.6%, a difference of 0.020%), Ute (56.6%, a difference of 0.020%), Estonian (56.6%, a difference of 0.050%), Yugoslavian (56.6%, a difference of 0.060%), and Bulgarian (56.5%, a difference of 0.080%).
| Demographics | Rating | Rank | 2 or more Vehicles in Household |
| Sioux | 93.8 /100 | #121 | Exceptional 56.8% |
| Immigrants | South Africa | 92.5 /100 | #122 | Exceptional 56.7% |
| Australians | 91.8 /100 | #123 | Exceptional 56.7% |
| New Zealanders | 91.8 /100 | #124 | Exceptional 56.7% |
| Tsimshian | 91.6 /100 | #125 | Exceptional 56.7% |
| Estonians | 90.9 /100 | #126 | Exceptional 56.6% |
| Immigrants | Thailand | 90.7 /100 | #127 | Exceptional 56.6% |
| Immigrants | South Central Asia | 90.5 /100 | #128 | Exceptional 56.6% |
| Ute | 90.4 /100 | #129 | Exceptional 56.6% |
| Yugoslavians | 90.0 /100 | #130 | Exceptional 56.6% |
| Bulgarians | 89.7 /100 | #131 | Excellent 56.5% |
| Hungarians | 89.1 /100 | #132 | Excellent 56.5% |
| Comanche | 88.4 /100 | #133 | Excellent 56.5% |
| Immigrants | Azores | 86.6 /100 | #134 | Excellent 56.4% |
| Blackfeet | 86.5 /100 | #135 | Excellent 56.4% |