Immigrants from Senegal vs Immigrants from Syria 4 or more Vehicles in Household
COMPARE
Immigrants from Senegal
Immigrants from Syria
4 or more Vehicles in Household
4 or more Vehicles in Household Comparison
Immigrants from Senegal
Immigrants from Syria
4.2%
4 OR MORE VEHICLES IN HOUSEHOLD
0.0/ 100
METRIC RATING
329th/ 347
METRIC RANK
6.3%
4 OR MORE VEHICLES IN HOUSEHOLD
52.8/ 100
METRIC RATING
170th/ 347
METRIC RANK
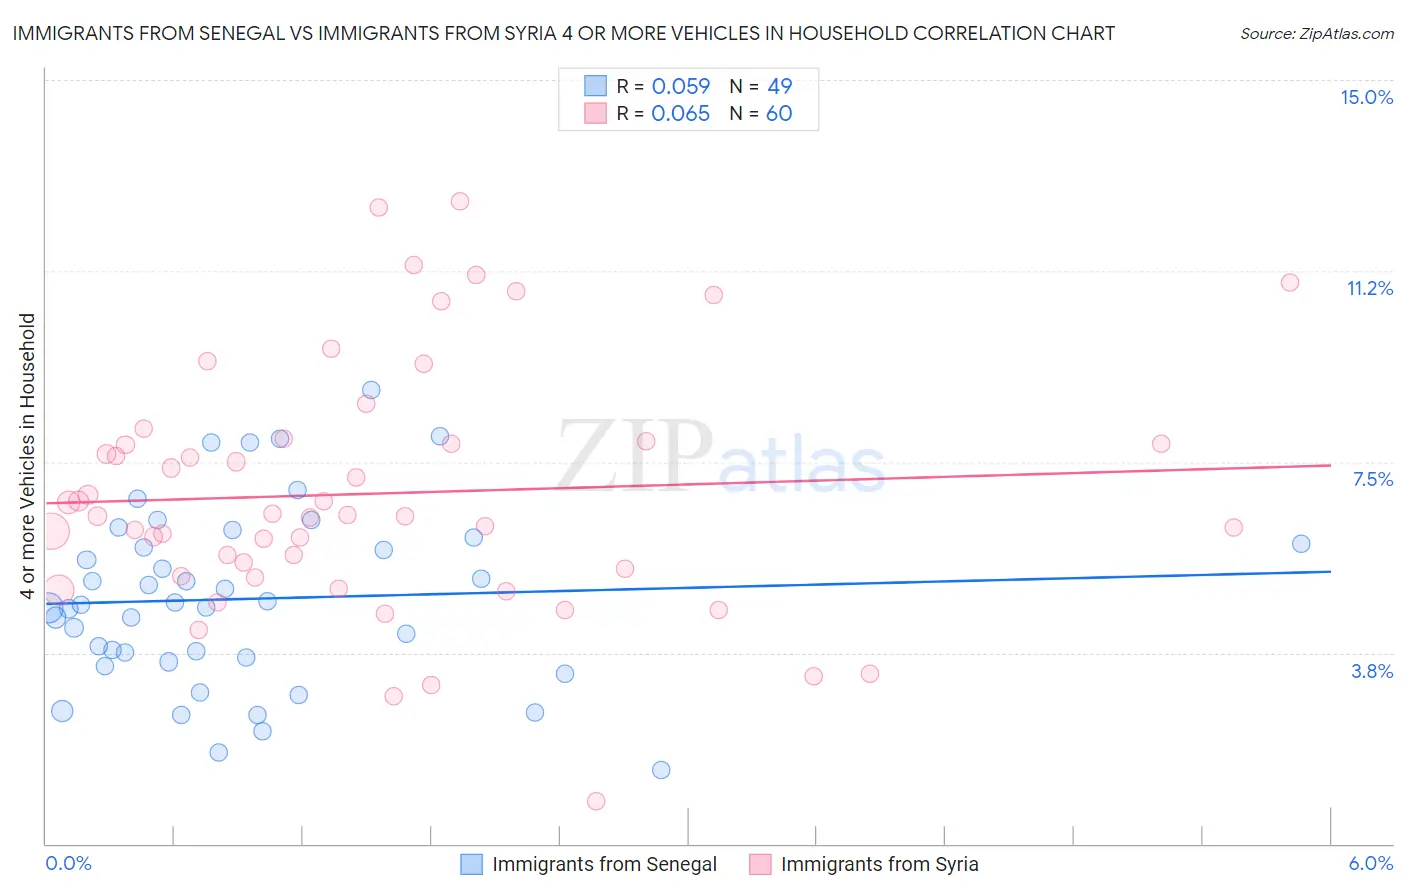
Immigrants from Senegal vs Immigrants from Syria 4 or more Vehicles in Household Correlation Chart
The statistical analysis conducted on geographies consisting of 89,828,164 people shows a slight positive correlation between the proportion of Immigrants from Senegal and percentage of households with 4 or more vehicles available in the United States with a correlation coefficient (R) of 0.059 and weighted average of 4.2%. Similarly, the statistical analysis conducted on geographies consisting of 173,706,064 people shows a slight positive correlation between the proportion of Immigrants from Syria and percentage of households with 4 or more vehicles available in the United States with a correlation coefficient (R) of 0.065 and weighted average of 6.3%, a difference of 49.5%.
4 or more Vehicles in Household Correlation Summary
| Measurement | Immigrants from Senegal | Immigrants from Syria |
| Minimum | 1.5% | 0.83% |
| Maximum | 8.9% | 12.6% |
| Range | 7.5% | 11.8% |
| Mean | 4.8% | 6.9% |
| Median | 4.7% | 6.4% |
| Interquartile 25% (IQ1) | 3.6% | 5.3% |
| Interquartile 75% (IQ3) | 6.0% | 7.9% |
| Interquartile Range (IQR) | 2.3% | 2.6% |
| Standard Deviation (Sample) | 1.7% | 2.4% |
| Standard Deviation (Population) | 1.7% | 2.4% |
Similar Demographics by 4 or more Vehicles in Household
Demographics Similar to Immigrants from Senegal by 4 or more Vehicles in Household
In terms of 4 or more vehicles in household, the demographic groups most similar to Immigrants from Senegal are Immigrants from Ecuador (4.2%, a difference of 0.20%), Trinidadian and Tobagonian (4.3%, a difference of 0.27%), West Indian (4.2%, a difference of 0.46%), Immigrants from Dominica (4.2%, a difference of 1.4%), and Senegalese (4.3%, a difference of 1.9%).
| Demographics | Rating | Rank | 4 or more Vehicles in Household |
| Immigrants | Yemen | 0.0 /100 | #322 | Tragic 4.5% |
| Immigrants | Caribbean | 0.0 /100 | #323 | Tragic 4.4% |
| Soviet Union | 0.0 /100 | #324 | Tragic 4.4% |
| Immigrants | Jamaica | 0.0 /100 | #325 | Tragic 4.4% |
| Cape Verdeans | 0.0 /100 | #326 | Tragic 4.4% |
| Senegalese | 0.0 /100 | #327 | Tragic 4.3% |
| Trinidadians and Tobagonians | 0.0 /100 | #328 | Tragic 4.3% |
| Immigrants | Senegal | 0.0 /100 | #329 | Tragic 4.2% |
| Immigrants | Ecuador | 0.0 /100 | #330 | Tragic 4.2% |
| West Indians | 0.0 /100 | #331 | Tragic 4.2% |
| Immigrants | Dominica | 0.0 /100 | #332 | Tragic 4.2% |
| Immigrants | Albania | 0.0 /100 | #333 | Tragic 4.1% |
| Immigrants | Trinidad and Tobago | 0.0 /100 | #334 | Tragic 4.1% |
| Barbadians | 0.0 /100 | #335 | Tragic 3.9% |
| Immigrants | Bangladesh | 0.0 /100 | #336 | Tragic 3.9% |
Demographics Similar to Immigrants from Syria by 4 or more Vehicles in Household
In terms of 4 or more vehicles in household, the demographic groups most similar to Immigrants from Syria are Immigrants from India (6.3%, a difference of 0.080%), Immigrants from Lebanon (6.3%, a difference of 0.11%), Slovene (6.3%, a difference of 0.16%), Estonian (6.4%, a difference of 0.24%), and Lithuanian (6.3%, a difference of 0.28%).
| Demographics | Rating | Rank | 4 or more Vehicles in Household |
| Chileans | 61.2 /100 | #163 | Good 6.4% |
| Hungarians | 61.1 /100 | #164 | Good 6.4% |
| Immigrants | Peru | 59.8 /100 | #165 | Average 6.4% |
| Immigrants | Denmark | 57.8 /100 | #166 | Average 6.4% |
| Poles | 56.9 /100 | #167 | Average 6.4% |
| Lebanese | 55.8 /100 | #168 | Average 6.4% |
| Estonians | 55.1 /100 | #169 | Average 6.4% |
| Immigrants | Syria | 52.8 /100 | #170 | Average 6.3% |
| Immigrants | India | 51.9 /100 | #171 | Average 6.3% |
| Immigrants | Lebanon | 51.7 /100 | #172 | Average 6.3% |
| Slovenes | 51.1 /100 | #173 | Average 6.3% |
| Lithuanians | 50.0 /100 | #174 | Average 6.3% |
| Immigrants | Western Europe | 48.8 /100 | #175 | Average 6.3% |
| Ukrainians | 47.6 /100 | #176 | Average 6.3% |
| Slovaks | 46.9 /100 | #177 | Average 6.3% |